Impact of Low-Emission Zones on Spatial and Economic Inequalities using a Dynamic Transport Simulator
André de Palma & Lucas Javaudin
THEMA, CY Cergy Paris Université
March 2025
Context
- Road transport sector is responsible for 43 % of nitrogen oxides emissions (NOx) in China (Statista, 2023)
- Long-term exposure to NO2 were associated to 285,036 non-accidental deaths, in China in 2019 (Li, Wang et al., 2023 [EnvInt])
- Popular instrument to improve air quality: Low Emission Zones (LEZ)
Low Emission Zones in France
- Low Emission Zone: area in the city center where the most polluting vehicles cannot travel
- In Europe, LEZs have been implemented in hundreds of cities as of today
- In France, 25 cities have implemented LEZs; cities are forced to implement a LEZ when pollution is above a threshold level
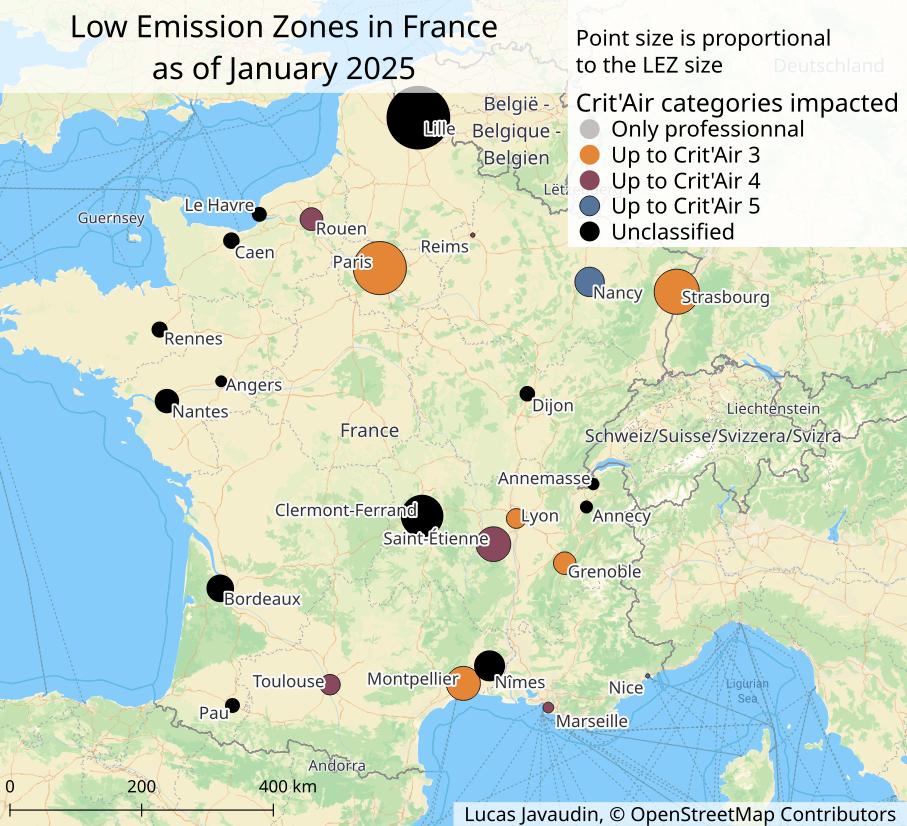
Crit'Air System
- Entry restrictions in the LEZ are based on the Crit'Air system
- Each vehicle is put in a Crit'Air category based on its fuel type (diesel, petrol, electric, etc.) and its age
A Controversial Policy
Arguments in favor of LEZ
- Improved air quality
- Decreased CO2 emissions
- Less noise pollution
- Less congestion
Arguments against LEZ
- Unfair: penalize people stuck with an old vehicle (poor and rural households)
- Some drivers might make a detour around the LEZ, polluting even more
- Drivers are induced to purchase new vehicles before their end-of-life
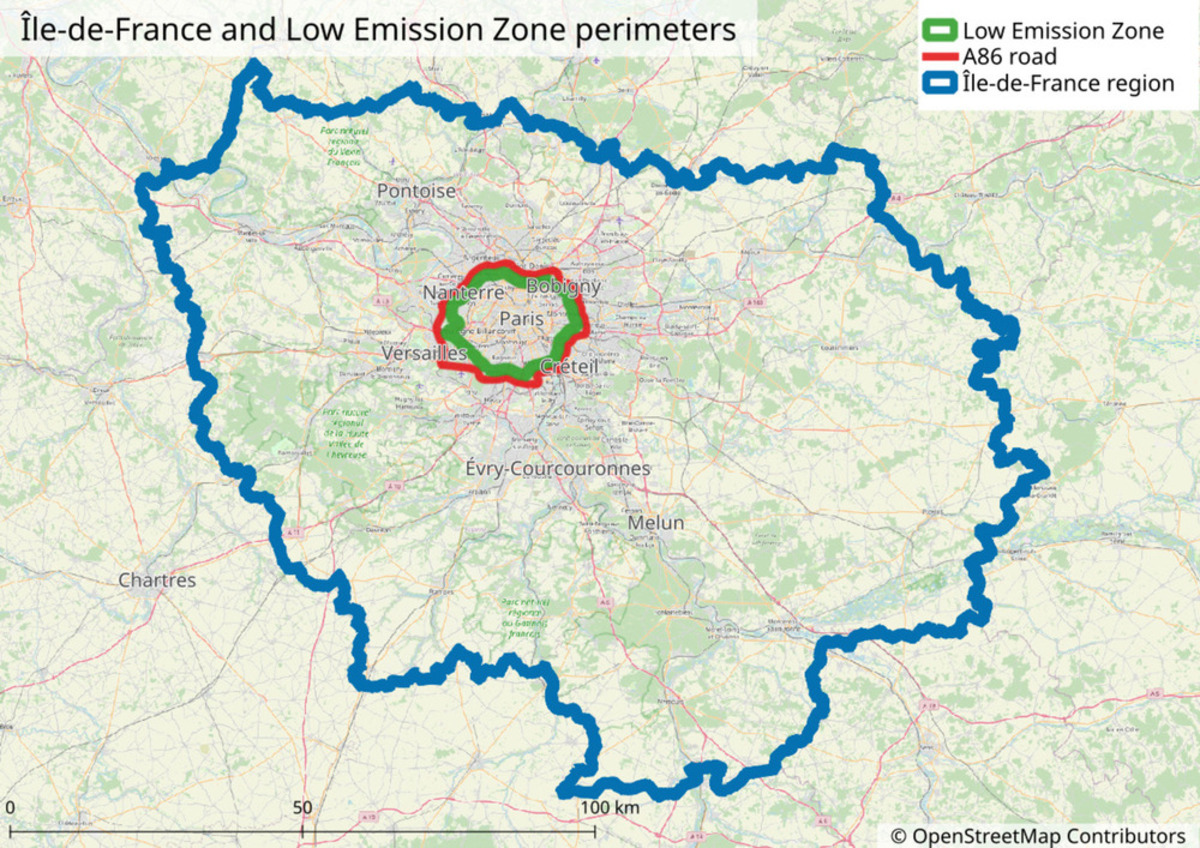
Paris' Low Emission Zone
- Paris and 76 neighbor municipalities
- 367 km2 area (3 % of Île-de-France)
- 5 M inhabitants (40 % of Île-de-France)
- A86 highway enables detours around the LEZ
- Since January 2025: Vehicles Crit'Air 3 or worst are banned
- 68 € fine for non-respect
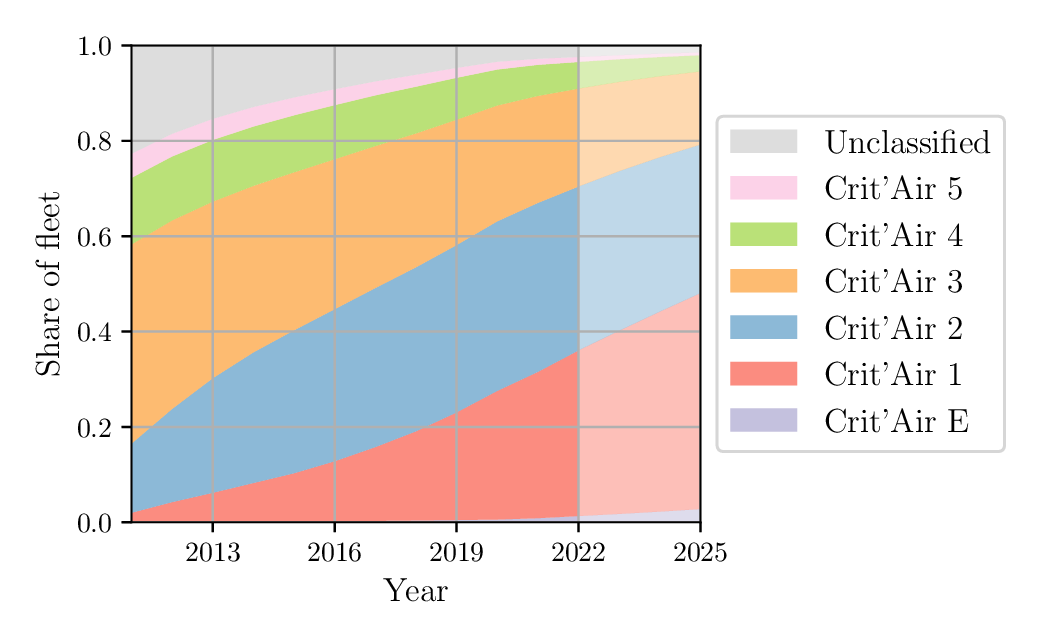
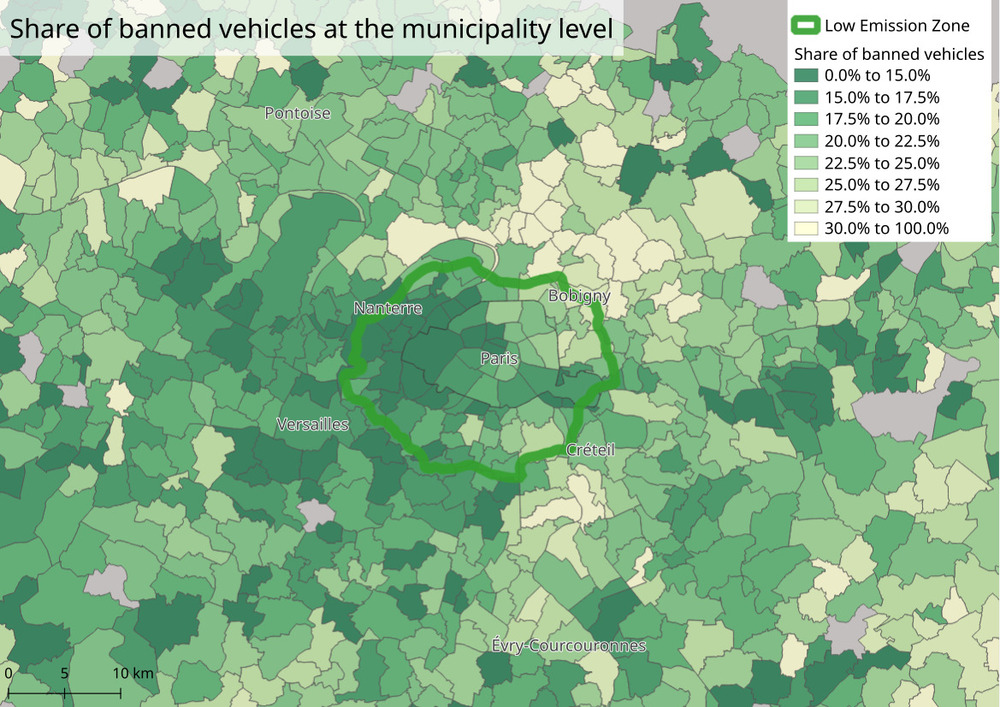
Île-de-France Vehicle Fleet
- Municipality-level vehicle fleet data (with Crit'Air categories) from the Ministry of Ecology
- Extrapolation to predict the fleet in 2025
- In 2025, around 21 % of vehicles in the region would be Crit'Air 3 or worst
Research Questions
Analysis of Paris' LEZ with a transport simulator (METROPOLIS2)- What is the global impact of the LEZ (on air quality, congestion, etc.)?
- Which people are winning and losing from the LEZ?
Introduction
-
Scope:
- Île-de-France
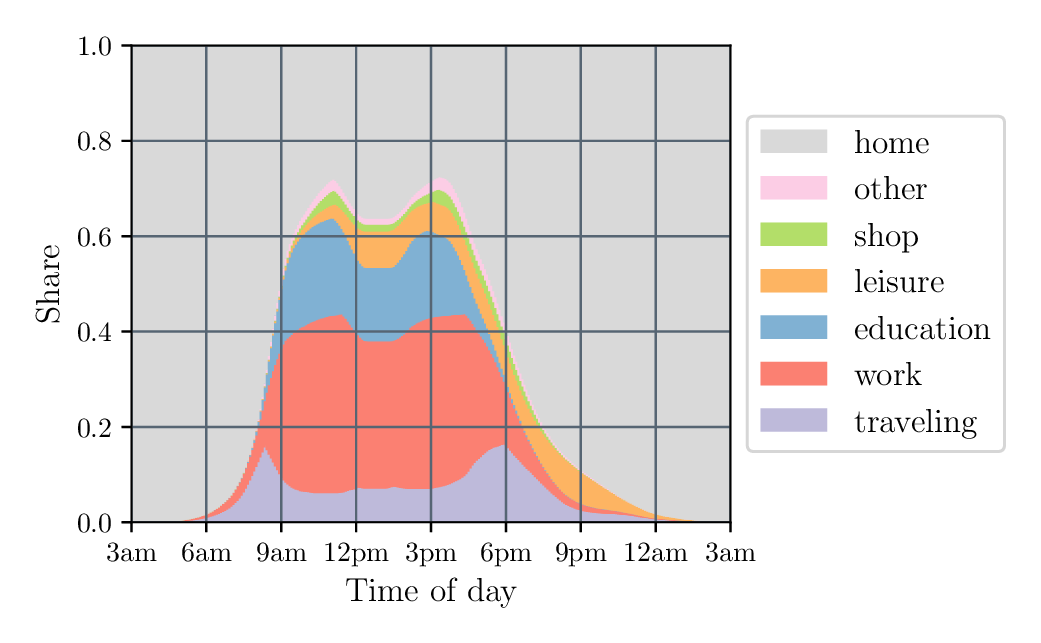
- Trips for an average working day
- Five modes : car (driver), car (passenger), public transit, bicycle and walking
- All trip purposes
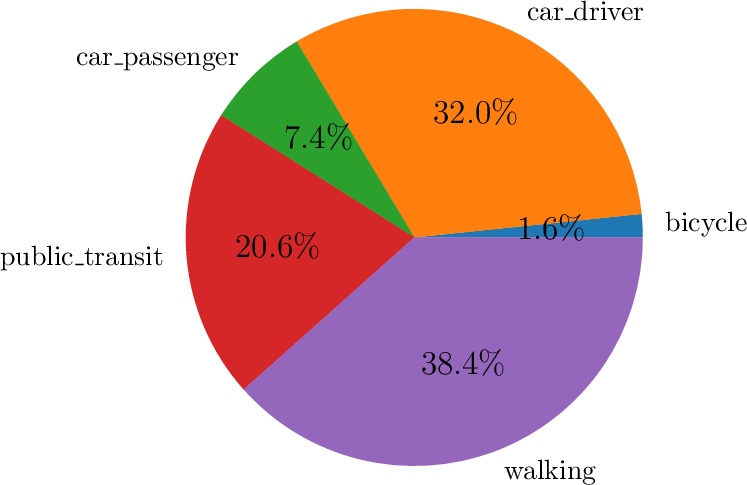
Source: Enquête Globale Transport (2010)
METROPOLIS2
- METROPOLIS2 is an agent-based dynamic mesoscopic transport simulator
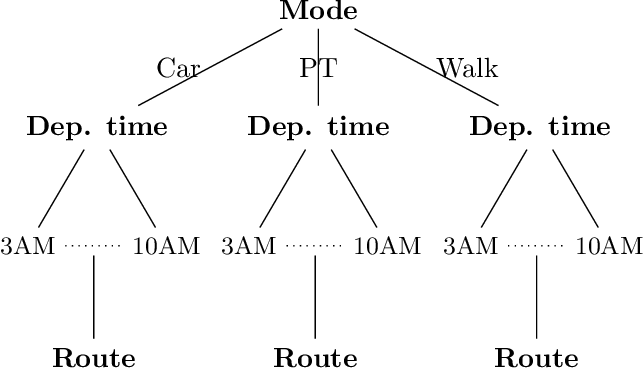
- Simulation of mode, departure time and route choice
- Congestion simulated from bottlenecks with queue propagation (spillback)
- Computation of pollutant emissions and exposure of population to pollutants with the METRO-TRACE module
Input Data
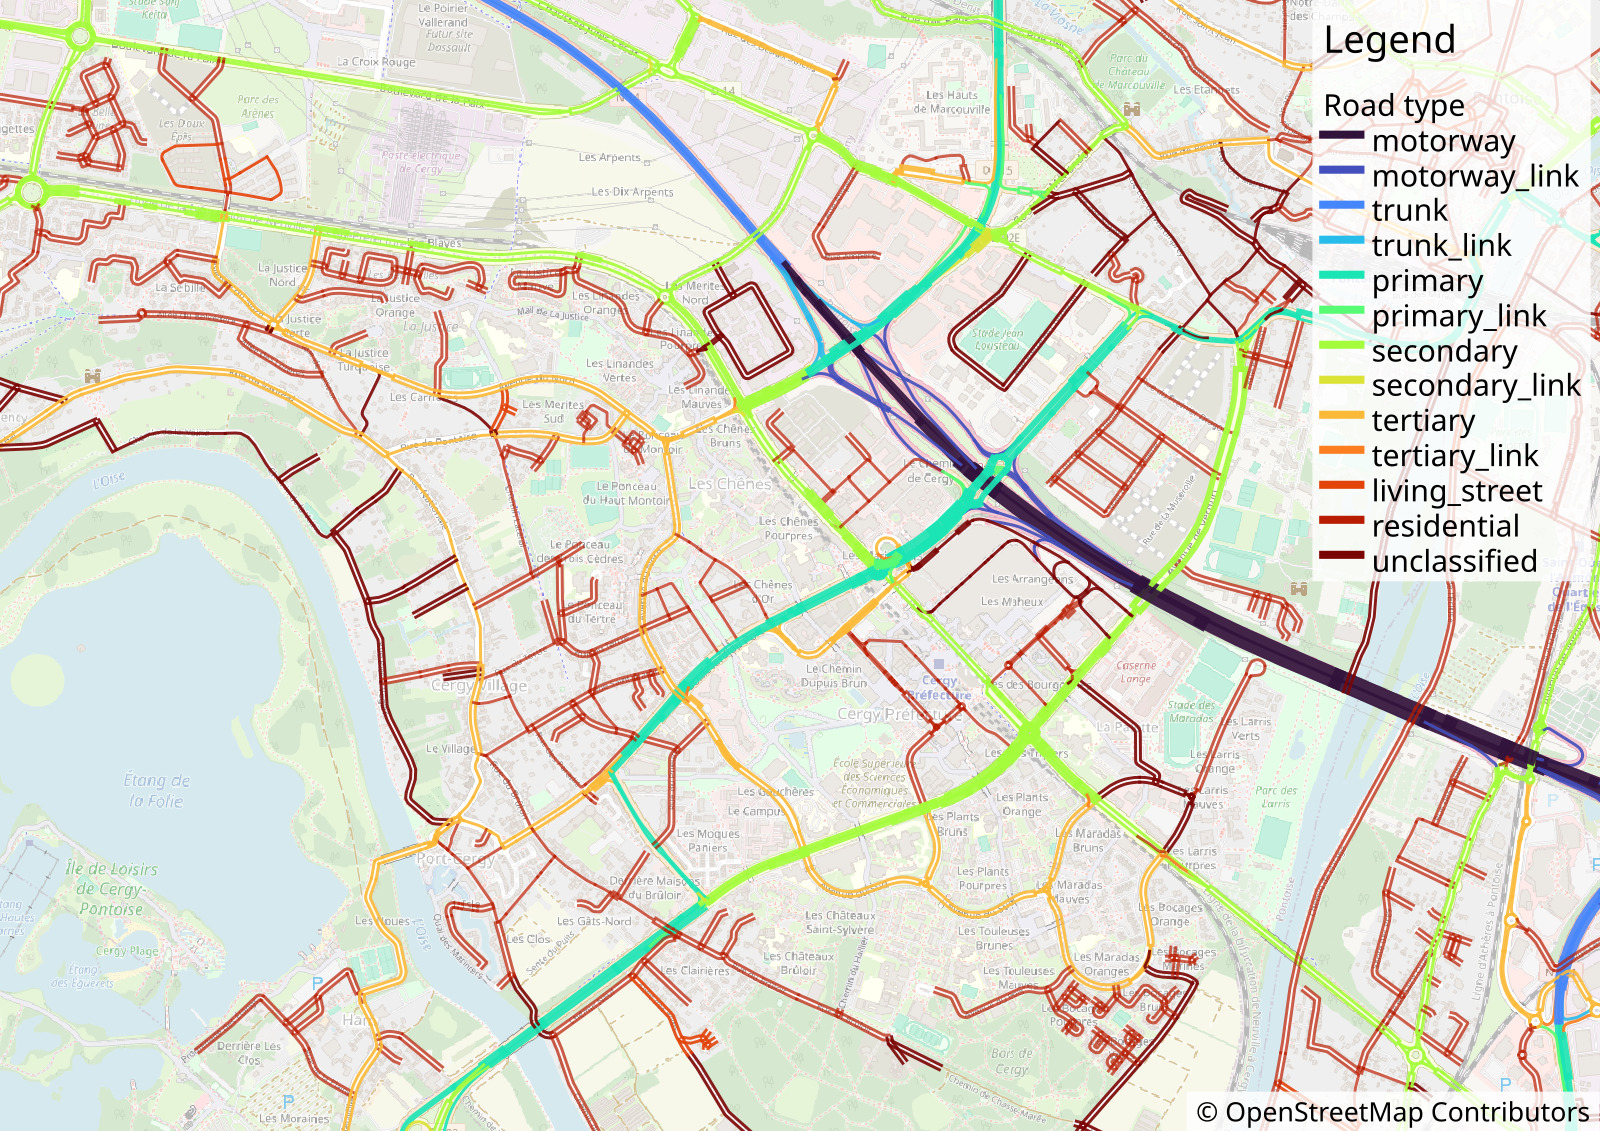
- Road network: OpenStreetMap [72,962 km of roads]
- Public transit timetable: GTFS [1850 lines]
- Trips : synthetic population (Hörl and Balac, 2021) [2,451,841 persons ; 8,774,929 trips]
Choice Models
- Mode choice: multinomial Logit model
- Departure time choice: continuous Logit model
- Route choice: fastest path
- Surplus computed from the log-sum formula
Utility function
Utility of trip $k$ with mode $j$:

- $t^{\text{d}}$: departure time ; $t^{\text{a}}$: arrival time
- $c_j$: mode constant ; $m_{k | j}$: monetary cost (fuel)
- $\alpha_j$: value of time
- $\beta_k$: early-arrival penalty ; $\gamma_k$: late-arrival penalty ; $t^*_k$: desired arrival time
Additional Hypothesis
- Car (driver) option only to car owners with driving license
- Car (passenger) option only available to car owners
- Public transit travel time computed with OpenTripPlanner and GTFS data
- Bicycle speed: 10 km/h
- Walking speed: 4 km/h
- 600 k truck trips are simulated
| Mode | Availability (baseline) | Availability (LEZ) | Constraint |
|---|---|---|---|
| Car (driver) | 53 % | 49 % | Authorized car in LEZ + driving license |
| Car (passenger) | 74 % | 68 % | Authorized car in LEZ |
| Public transit | 54 % | 54 % | Feasible itinerary |
| Bicycle | 100 % | 100 % | |
| Walking | 100 % | 100 % |
Calibration
| Step | Calibrated parameters | Target values | Target source | Methodology |
|---|---|---|---|---|
| 1 | Road constant penalties and free-flow speed | Free-flow travel times | TomTom API | LASSO regression |
| 2 | Road capacities | Time-dependent congested travel times | TomTom API | OLS regression |
| 3 | Schedule-delay penalties by purpose | Distribution of departure times by cluster | Travel survey (EGT) | Bayesian Optimization and Gaussian Process |
| 4 | Mode-specific utility parameters by socio-demographic characteristics | Mode shares by cluster | Travel survey (EGT) | Random Forest regression |
LEZ Policy Evaluation
-
Two METROPOLIS2 simulations:
- Baseline simulation (calibrated): no LEZ
- LEZ simulation (counterfactual): January 2025 LEZ (Crit'Air 3 and worse)
-
Limits:
- Short-run analysis: no car-ownership model, no relocation (of activities or homes)
- Temporal restrictions of the LEZ not considered
- Exceptions and cheating not considered
Aggregate Results
| Baseline | LEZ | Variation | |
|---|---|---|---|
| Average travel surplus | -28.96 € | -29.03 € | -0.07 € |
| Average travel time (all modes) | 01:12:05 | 01:12:55 | +50s |
| Vehicle-kilometers | 123.30 M km | 119.72 M km | -2.9 % |
Mode shifts
| Baseline / LEZ | Car (driver) | Car (passenger) | Public transit | Bicycle | Walking | Total (Baseline) |
|---|---|---|---|---|---|---|
| Car (driver) | 28.6% | · | 1.4% | 0.2% | 0.3% | 30.5% |
| Car (passenger) | · | 5.3% | 0.2% | · | · | 5.5% |
| Public transit | 0.4% | 0.1% | 18.4% | · | · | 18.9% |
| Bicycle | · | · | · | 1.1% | · | 1.1% |
| Walking | · | · | · | · | 43.9% | 43.9% |
| Total (LEZ) | 29.1% | 5.4% | 19.9% | 1.4% | 44.2% | 100% |
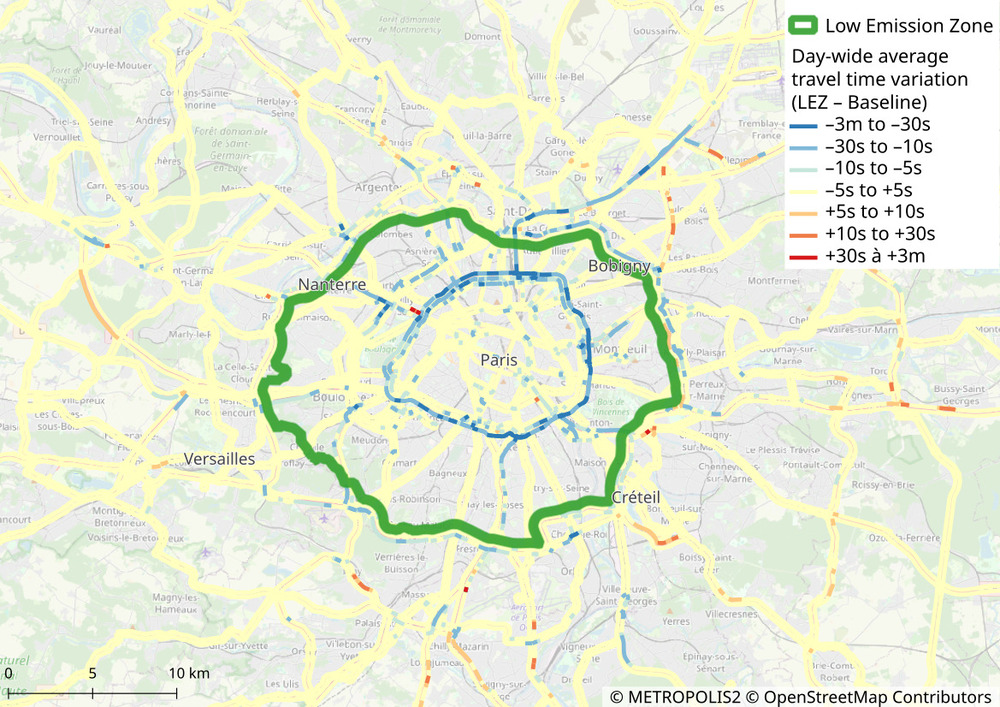
Road Congestion Impact
- Road congestion decreases on the main highways inside the LEZ (Boulevard Périphérique and A1 motorway)
- Little impact outside the LEZ
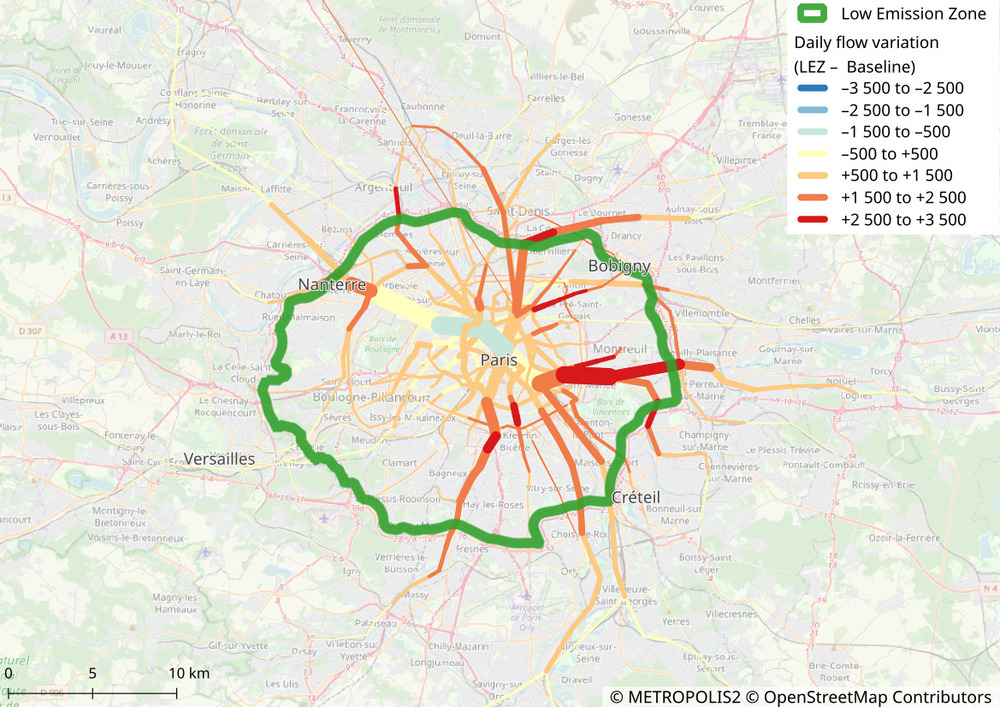
Public Transit Flows Impact
- Public transit mode share increases from 18.9% to 19.9%
- Larger flows on most legs, mainly in the surroundings of Paris (North, East and South)
- RER A: +1.2% passengers-kilometers
- RER B: +2.1% passengers-kilometers
- Tramway T7: +24.4% passengers-kilometers
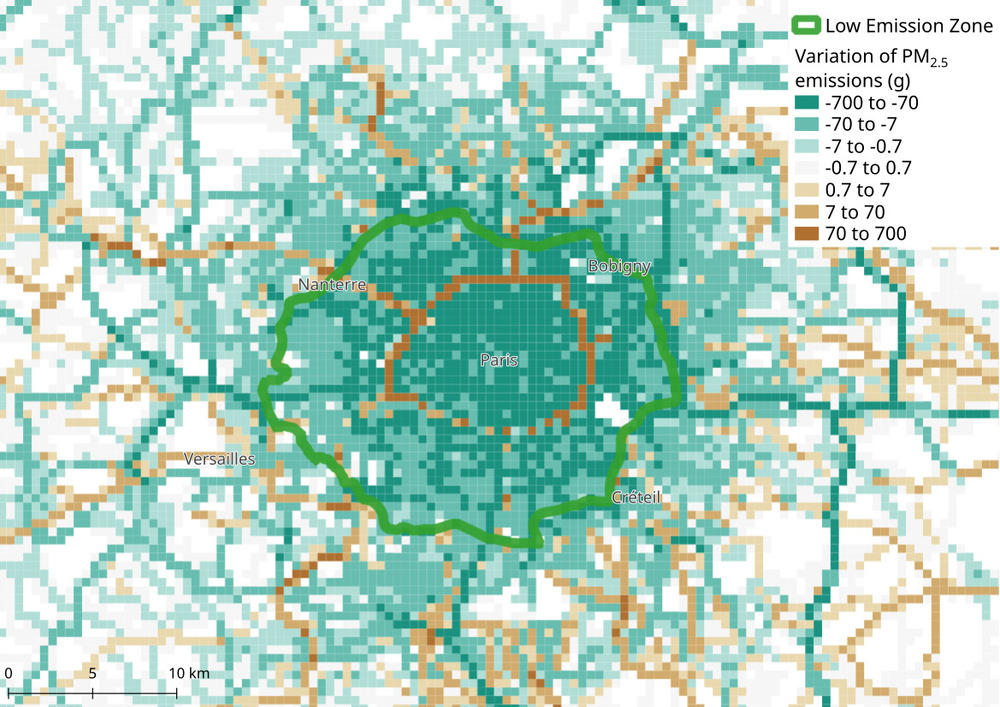
Pollutant Emissions
- Emissions of PM2.5 and NOx generated by road traffic are computed from the EMISENS model with COPERT emission factors
- Emissions depend on vehicles fuel type and age as well as instantaneous speed (link-level)
- Emissions decrease more inside the LEZ
| Baseline | LEZ | Variation | |
|---|---|---|---|
| PM2.5 emissions | 2.83 tons | 2.66 tons | -6.0 % |
| NOx emissions | 33.32 tons | 30.45 tons | -8.6 % |
| CO2 emissions | 21 730 tons | 20 829 tons | -4.1 % |
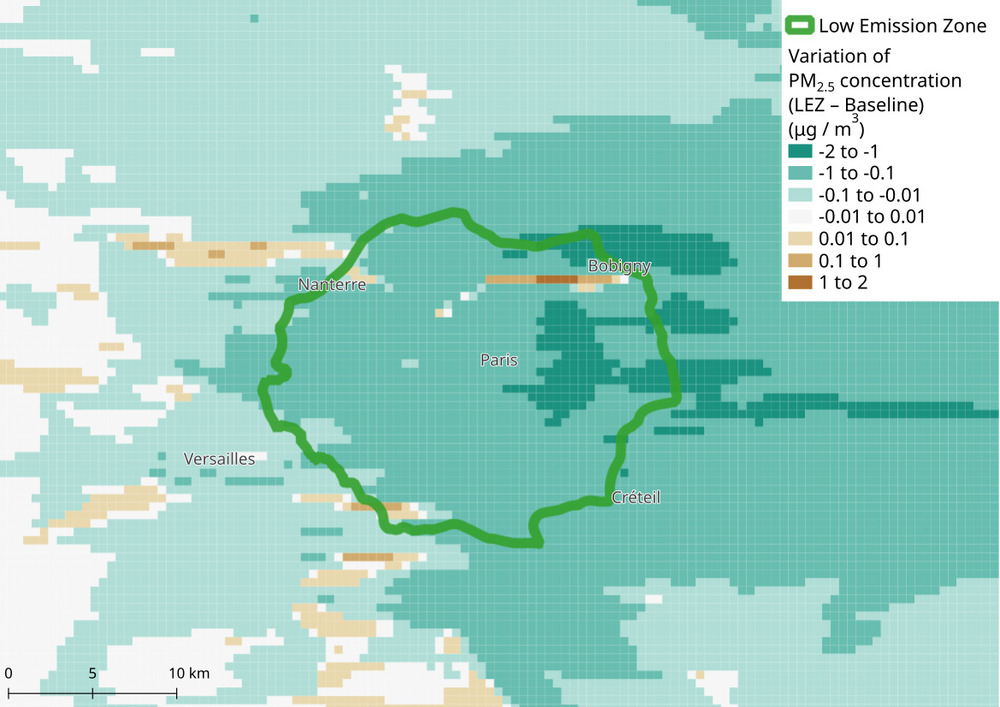
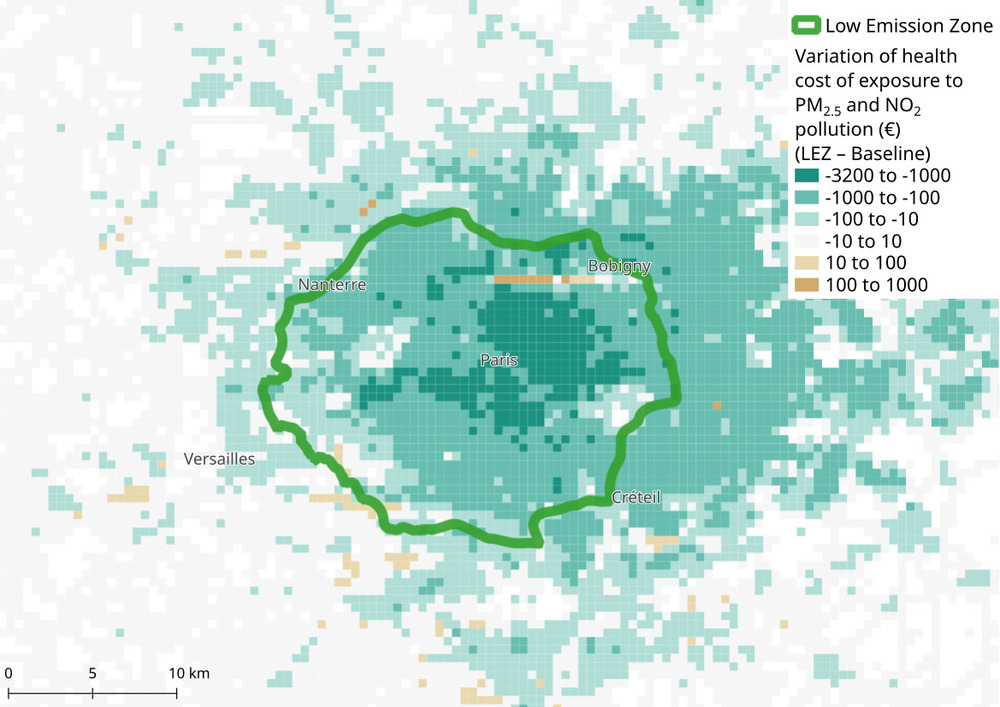
Pollutant Dispersion
- PM2.5 and NOx emissions are dispersed in the air using a Gaussian Plume model
- Dispersion depends on wind's average speed and direction (Eastward, 10 km/h)
- Concentration in pollutants decreases more inside the LEZ and East of the LEZ (which were initially more polluted)
Population Exposure to Pollution
- Health impact is a function of the increase in mortality due to exposure to pollutants, given the concentration levels
- Exposure is computed based on the actual location of individuals in time and space
- Exposure decreases more near Paris (high concentration and high population density)
| Baseline | LEZ | Variation | |
|---|---|---|---|
| PM2.5 premature deaths | 5.9 | 5.3 | -9.4 % |
| NOx premature deaths | 5.4 | 4.9 | -10.1 % |
| Health surplus | -12.537 M € | -11.312 M € | -9.8 % |
Health Impact: Summary
| Variation | |
|---|---|
| Vehicles-kilometers | -2.9 % |
| PM2.5 emissions | -6.0 % |
| PM2.5 premature deaths | -9.4 % |
Analysis in vehicle-kilometers is not precise enough:
- The decrease in vehicle-kilometers is stronger for the most polluting vehicles
- Air quality mostly improves inside the LEZ where population density is higher
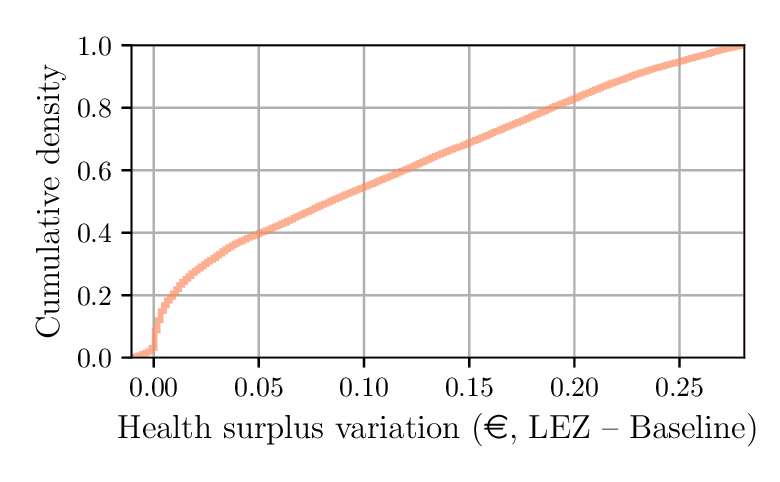
Heterogeneous Impacts
- Health impact: between 0 et +30 cents per day per individual
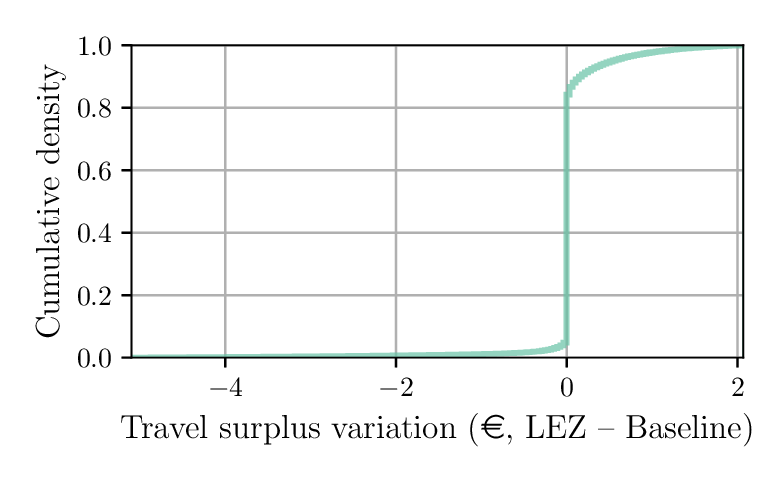
-
Travel impact:
- 93.2 % are not significantly impacted (variation smaller than 1 € daily)
- 3.5 % "win" more than 1 € daily
- 3.3 % "lose" more than 1 € daily
Winners and Losers Characteristics
| Winners | Losers | Insignificantly Impacted | |
|---|---|---|---|
| Criteria | $\Delta \text{travel surplus} \geq 1$ € / day | $\Delta \text{travel surplus} \leq -1$ € / day | $|\Delta \text{travel surplus}| \lt 1$ € / day |
| Average travel surplus variation | +2.0 € | -7.2 € | +0.0 € |
| Authorized car owners | 97 % | 4 % | 53 % |
| Banned car owners | 3 % | 96 % | 19 % |
| Mean trip distance | 45 km | 32 km | 15 km |
| Access to public transit | 51 % | 64 % | 85 % |
| Car mode share (baseline) | 79 % | 79 % | 33 % |
| Car mode share (LEZ) | 83 % | 1 % | 33 % |
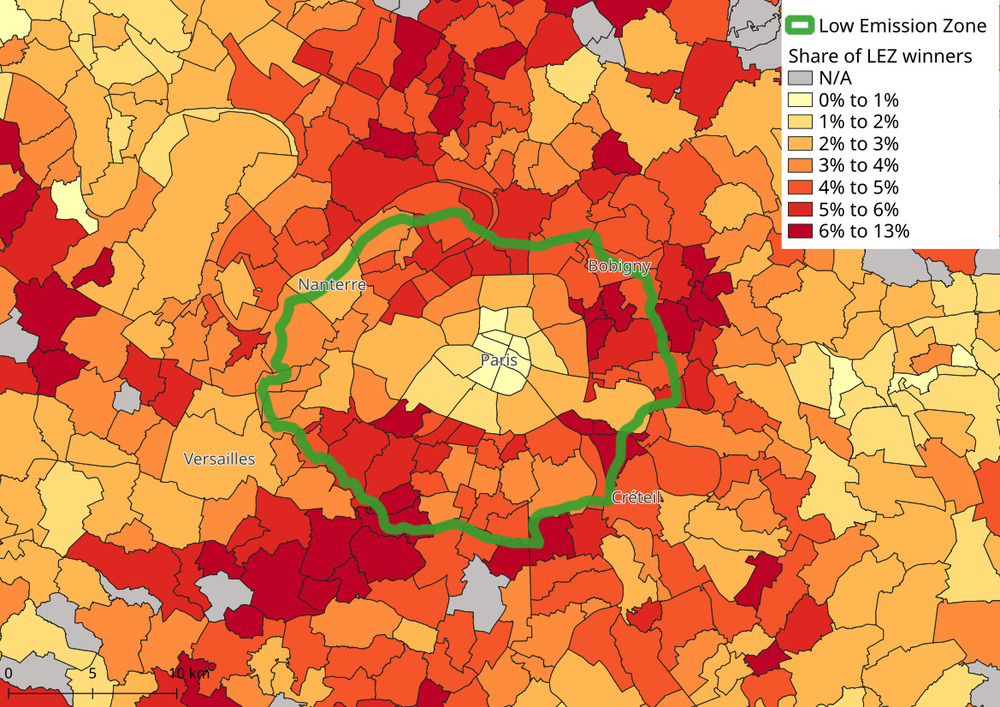
Winners and Losers Location
- "Winners" are spread over the region
- "Losers" are mainly living along the LEZ
 Winners
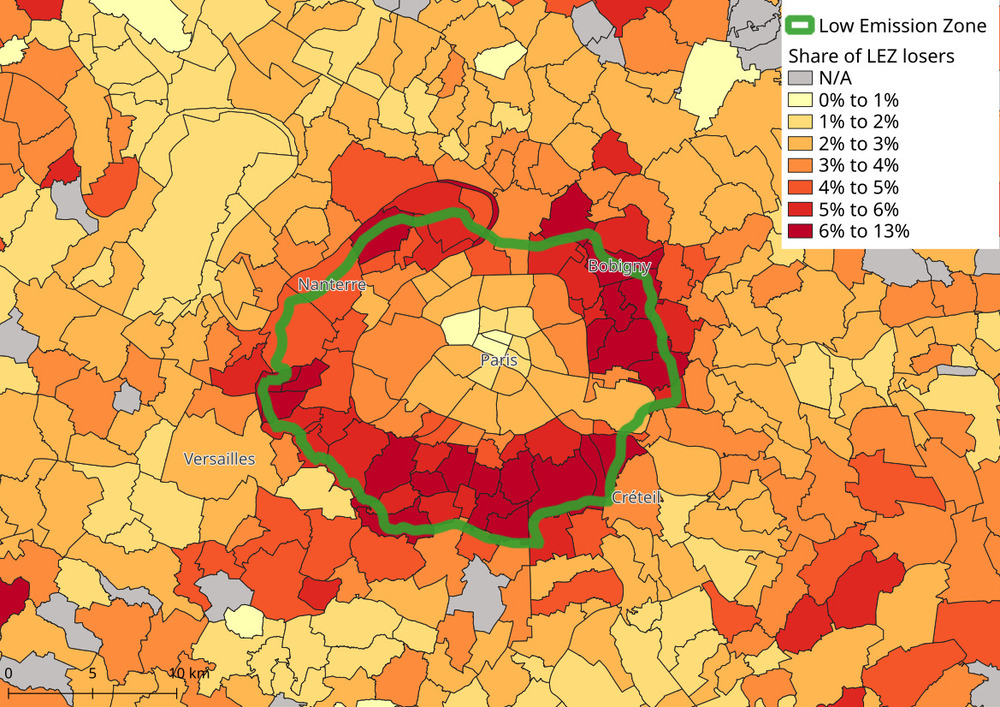 Losers
Winners and Losers Income
- Share of "winners" slightly increasing with the municipality average income
- Share of "losers" uncorrelated with the municipality average income
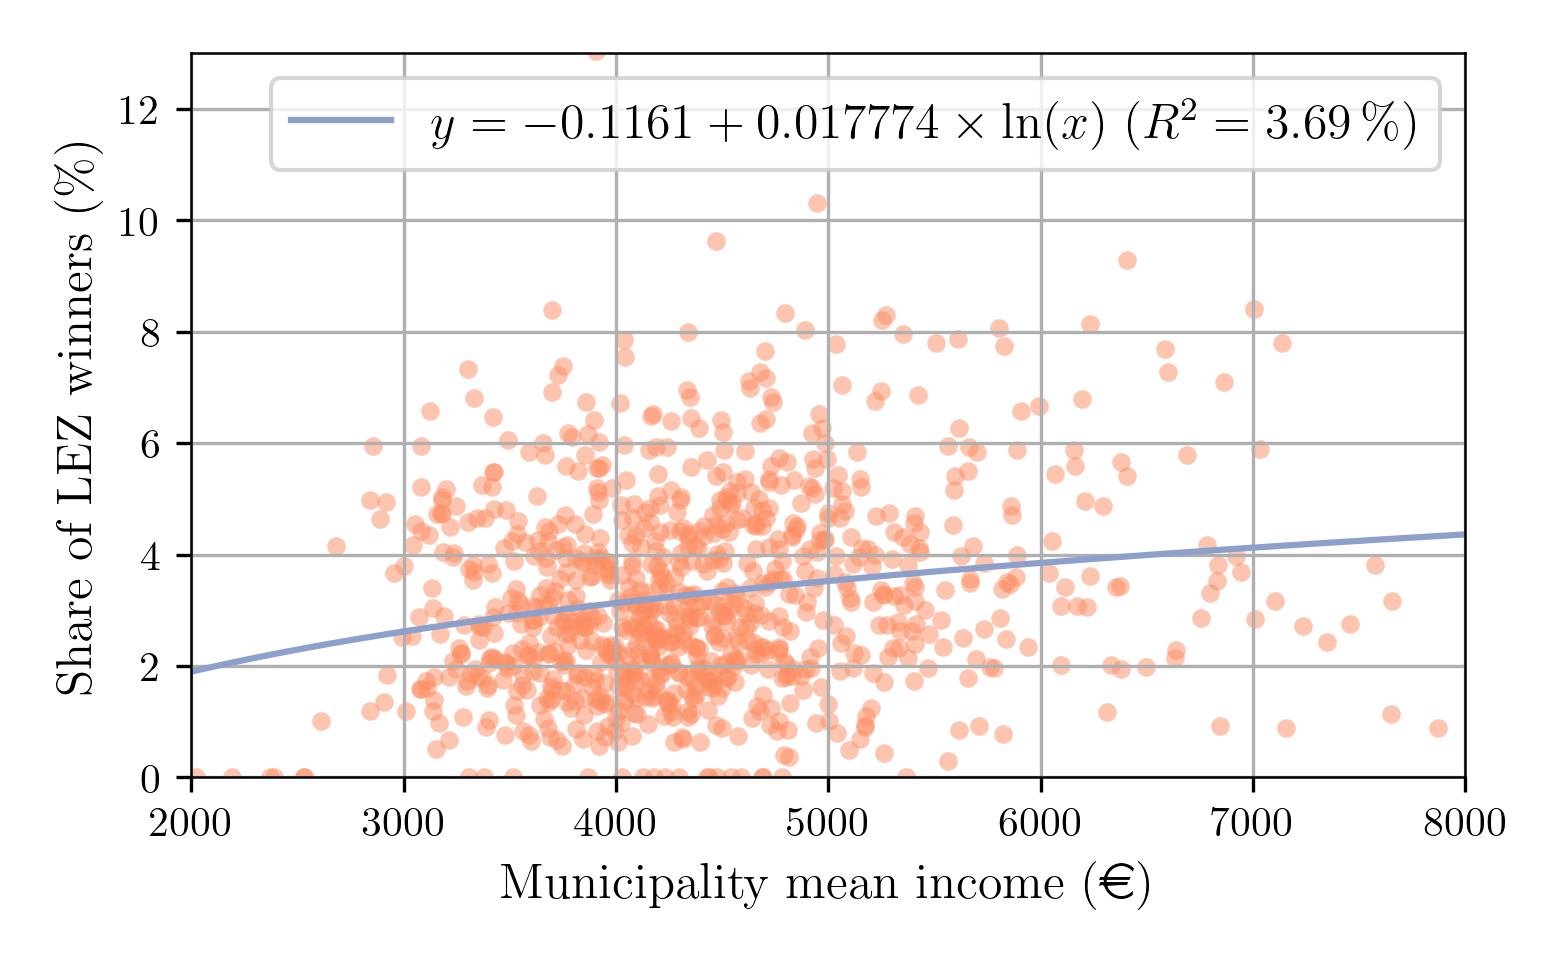 Winners
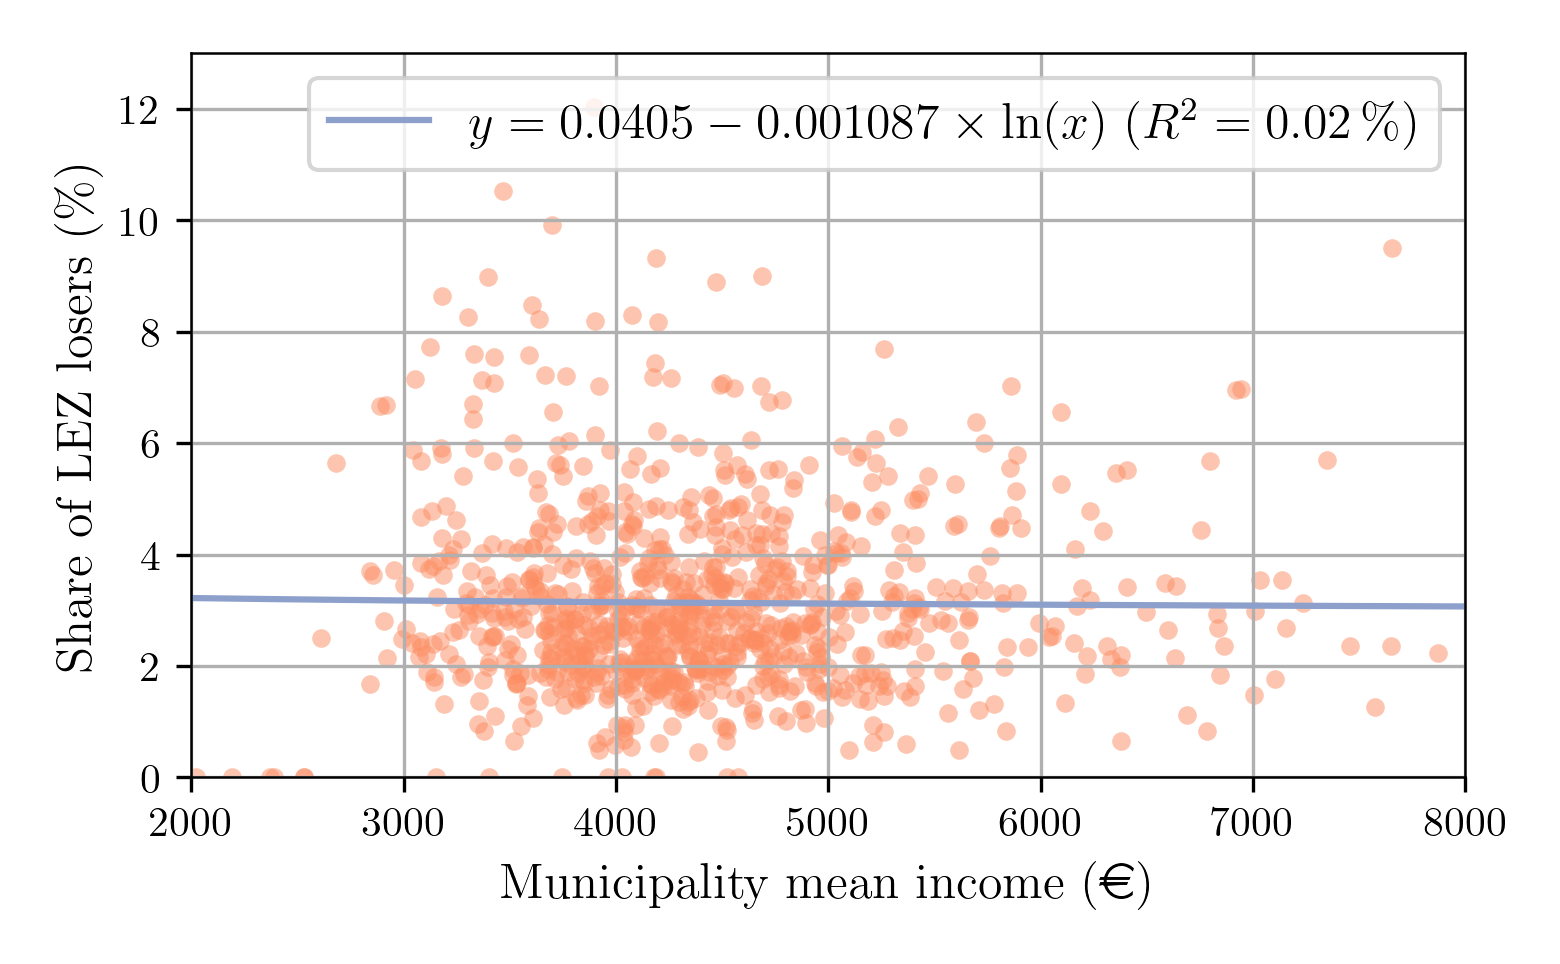 Losers
Conclusion
Conclusion
- Methodology for the evaluation of public policies with a transport simulator
- Global impact: decrease of car use, vehicle kilometers, congestion and pollution
- Individual impact:
- Health impact distributed evenly across the population
- Travel surplus impact shows great disparities
- Characteristics of the winners and losers of the policy
- Limits:
- No analysis of the income effect at the individual level
- Short-run analysis: no car-ownership model, no activity-based model, no location choice model
- Air pollution from public transit omitted
Air Pollution from Public Transit
- Sources of pollution: friction from brakes, wheels and rails, exacerbated with poor air circulation
- PM2.5 concentrations are higher in subway systems than in ambient air, in China (Ji, Liu, et al., 2021)
- If public-transit share increases significantly, LEZs can increase exposure to PM2.5
- Mitigation measures: improving ventilation, platform screen doors (Wen, Leng et al., 2020)