Impact of Low-Emission Zones on Spatial and Economic Inequalities
using a Dynamic Transport Simulator
André de Palma & Lucas Javaudin
THEMA, CY Cergy Paris Université
June 2025, European Transport Congress
Context
-
Road transport sector is responsible for 37 % of nitrogen oxides emissions (NOx) in Europe (EEA, 2021)
-
Nitrogen oxide pollution causes around 40,000 premature deaths yearly in Europe (EEA, 2021)
-
Air pollution causes about 7,920 premature deaths yearly in Paris' urban area, Île-de-France (AirParif, 2022)
-
Popular instrument to improve air quality: Low Emission Zones (LEZ)
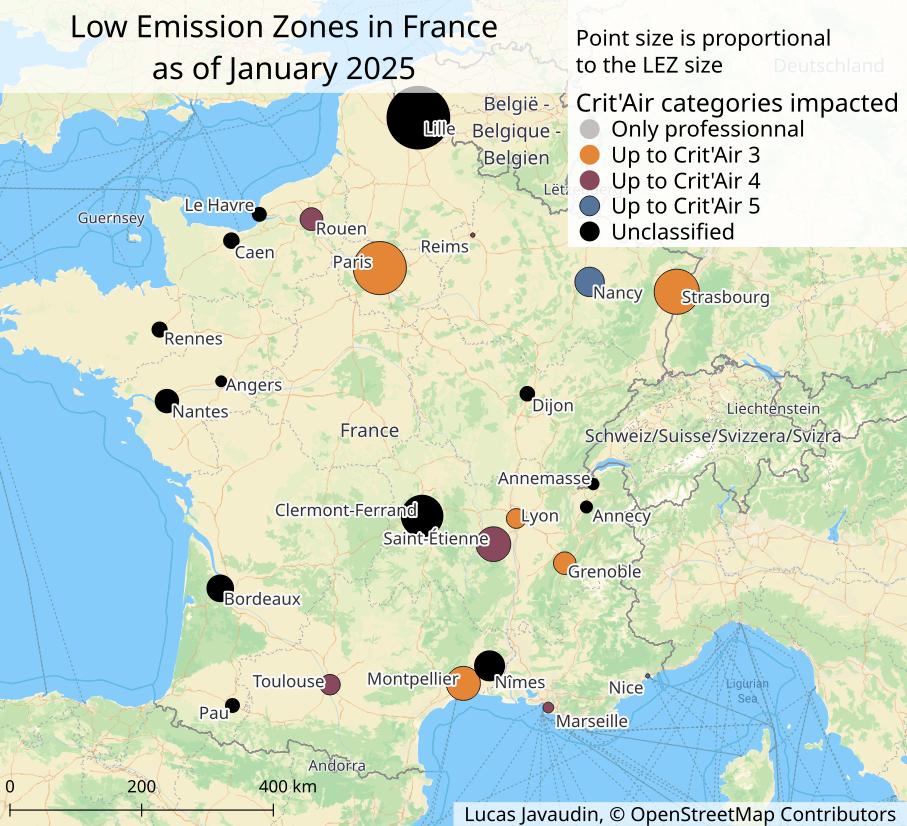
Low Emission Zones in France
- Low Emission Zone: area in the city center where the most polluting vehicles cannot travel
-
In Europe, LEZs have been implemented in hundreds of cities as of today
-
In France, 25 cities have implemented LEZs; cities are forced to implement a LEZ when pollution is above a threshold level
- [May 2025] Draft law in France that would prohibit LEZs across the country: "low-income households are now forced to choose between incurring significant additional costs to puchase a cleaner vehicle or giving up mobility altogether"
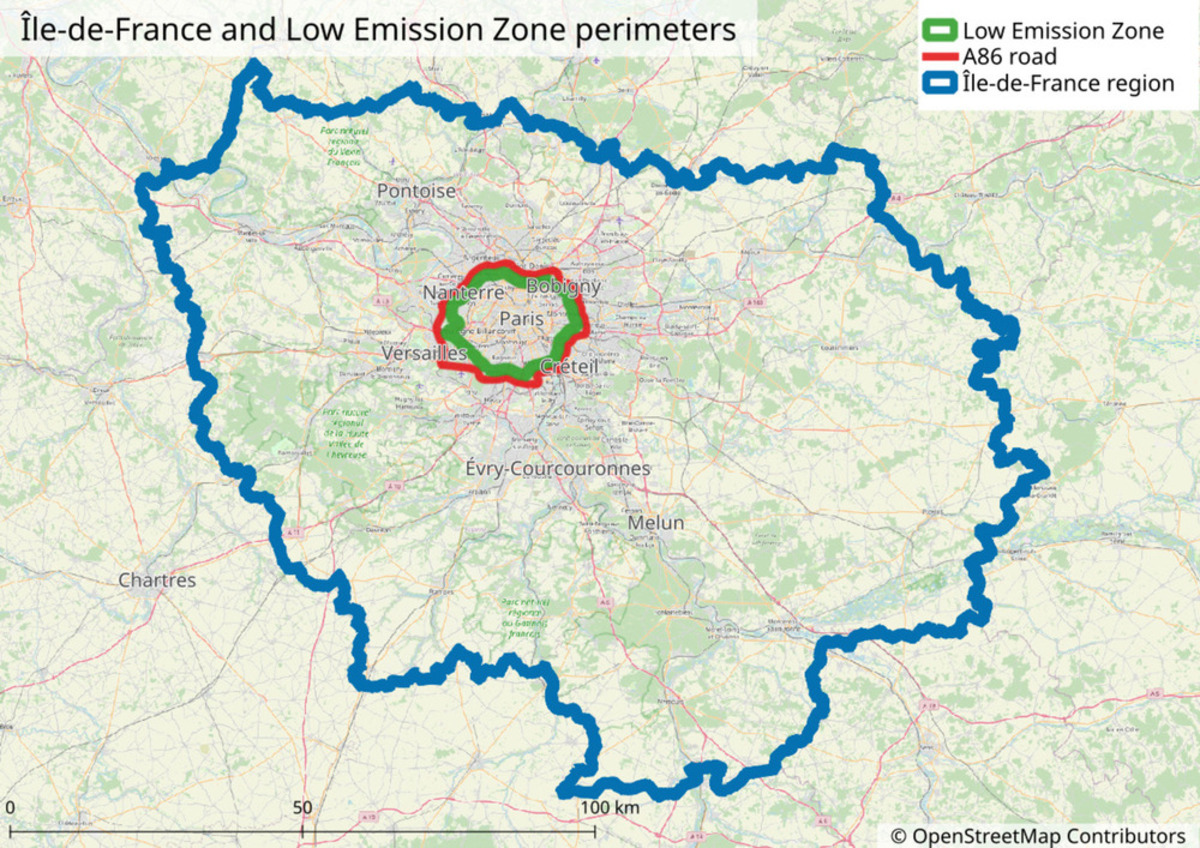
Paris' Low Emission Zone
- Paris and 76 neighbor municipalities
- 367 km2 area (3 % of Île-de-France)
- 5 M inhabitants (40 % of Île-de-France)
- A86 highway enables detours around the LEZ
-
Since January 2025: Vehicles Crit'Air 3 or worst are banned
- Crit'Air categories are based on fuel type (diesel, petrol, electric, etc.) and age
-
68 € fine for non-respect

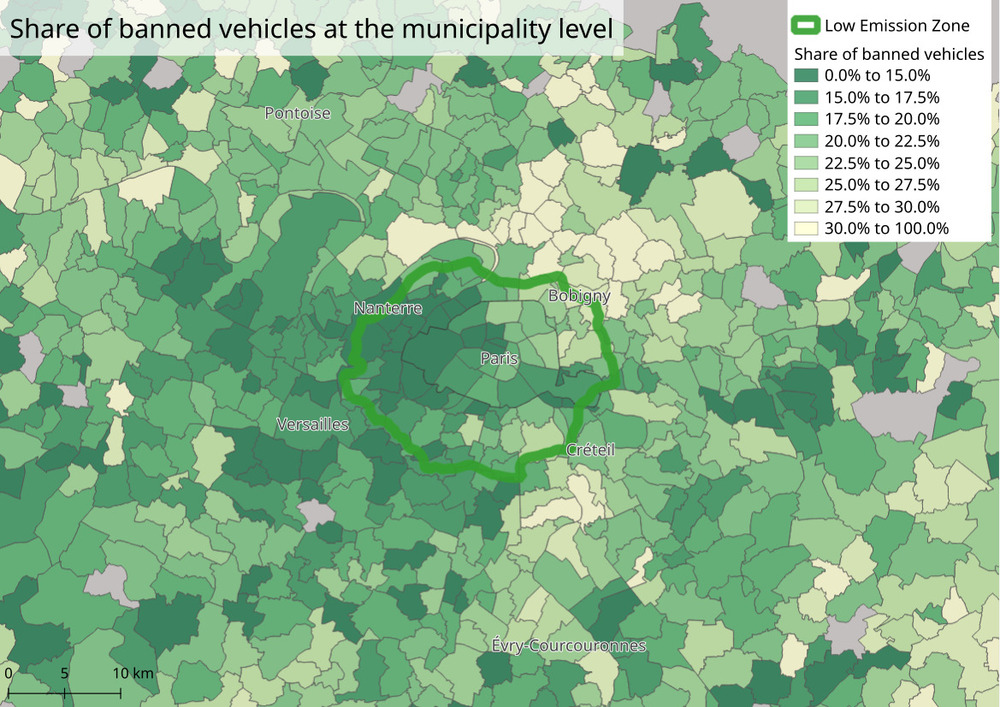
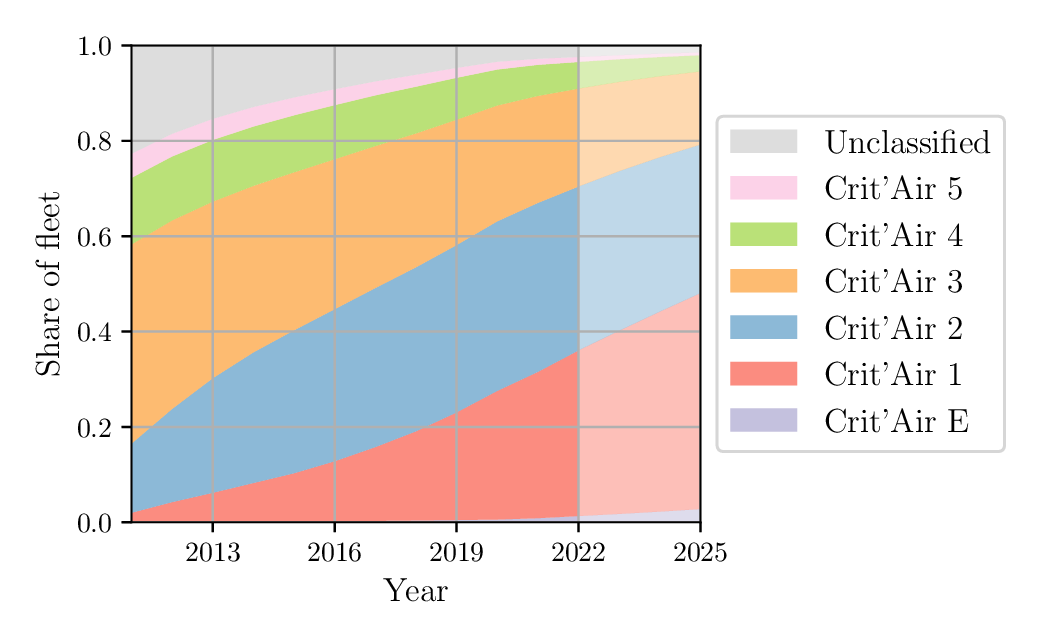
Île-de-France Vehicle Fleet
- Municipality-level vehicle fleet data (with Crit'Air categories) from the Ministry of Ecology
- Extrapolation to predict the fleet in 2025
- In 2025, around 21 % of vehicles in the region would be Crit'Air 3 or worst
Introduction
- We conduct transport simulations to evaluate ex-ante the impact of the LEZ in Paris
-
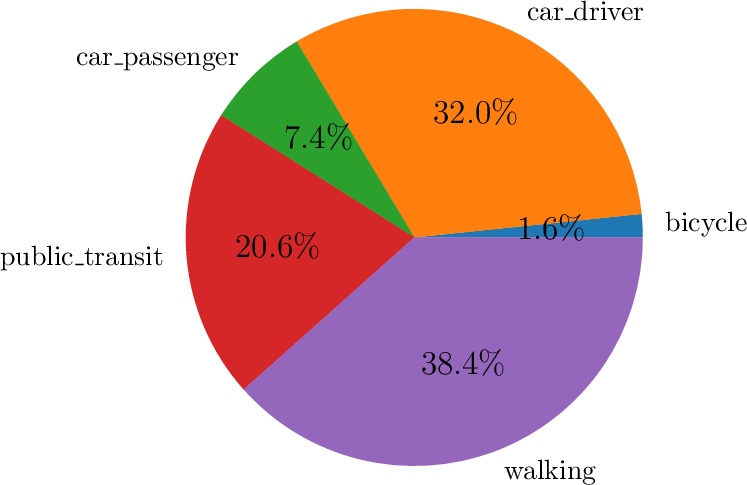
Scope:
- Île-de-France
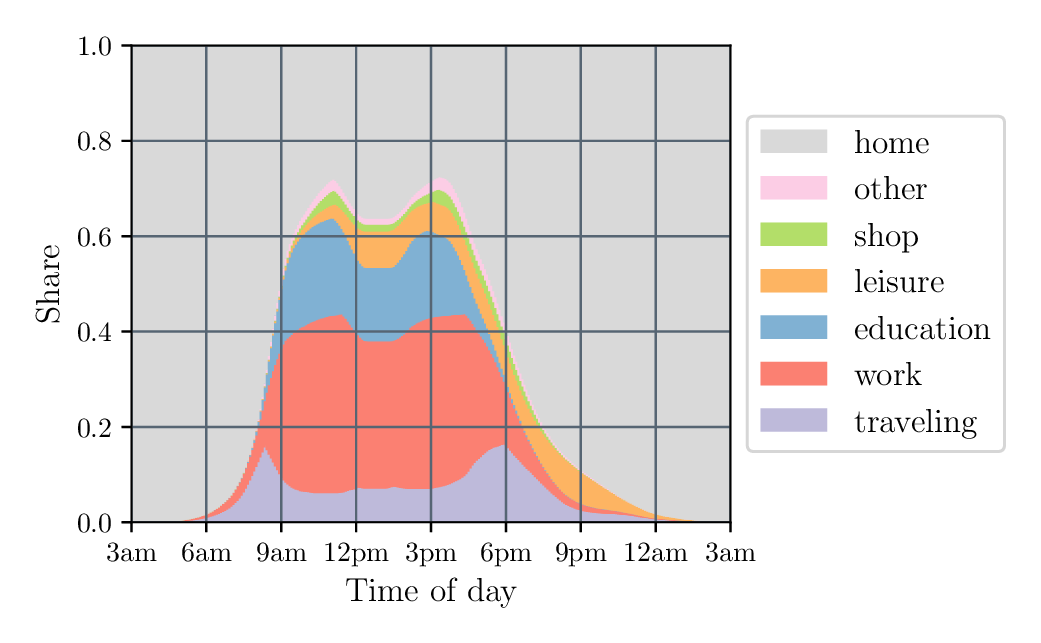
- Trips for an average working day
- Five modes : car (driver), car (passenger), public transit, bicycle and walking
- All trip purposes
Source: Enquête Globale Transport (2010)
METROPOLIS2
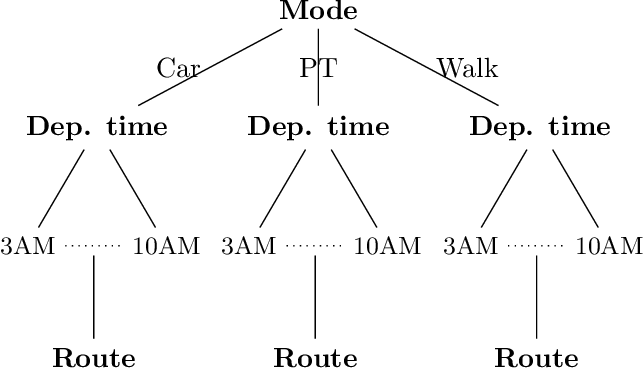
- METROPOLIS2 is an agent-based dynamic mesoscopic transport simulator
- Simulation of mode, departure time and route choice, based on discrete-choice theory
- Congestion simulated from bottlenecks with queue propagation (spillback)
- Computation of pollutant emissions and exposure of population to pollutants with the METRO-TRACE module
LEZ Policy Evaluation
-
Two METROPOLIS2 simulations:
- Baseline simulation (calibrated): no LEZ
- LEZ simulation (counterfactual): January 2025 LEZ (Crit'Air 3 and worse)
-
Limits:
- Short-run analysis: no car-ownership model, no relocation (of activities or homes)
- Temporal restrictions of the LEZ not considered
- Exceptions and cheating not considered
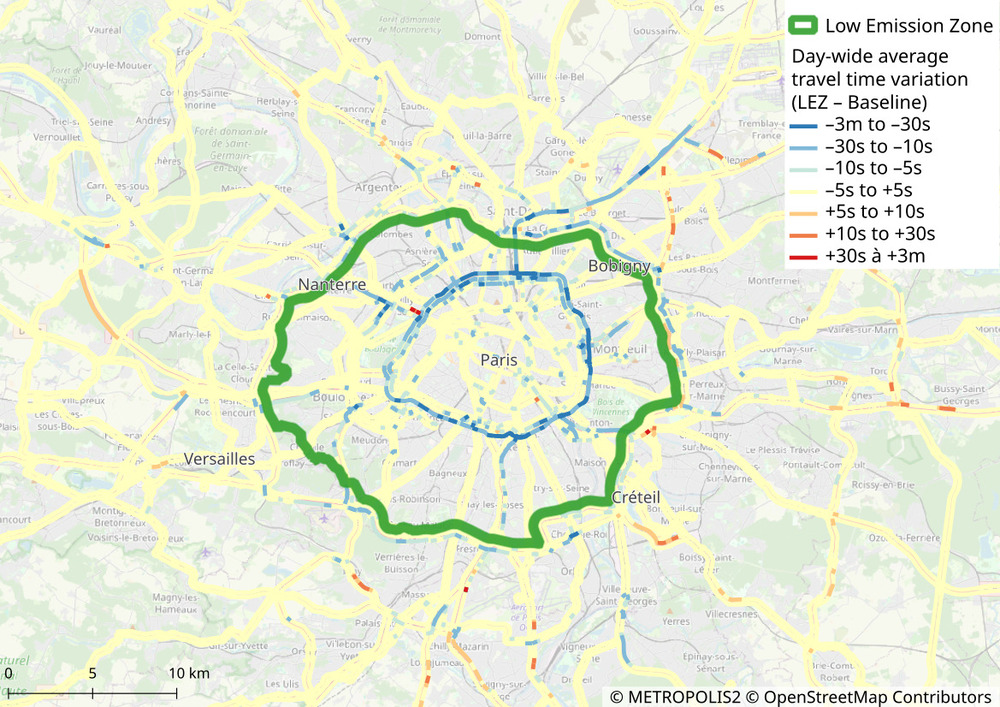
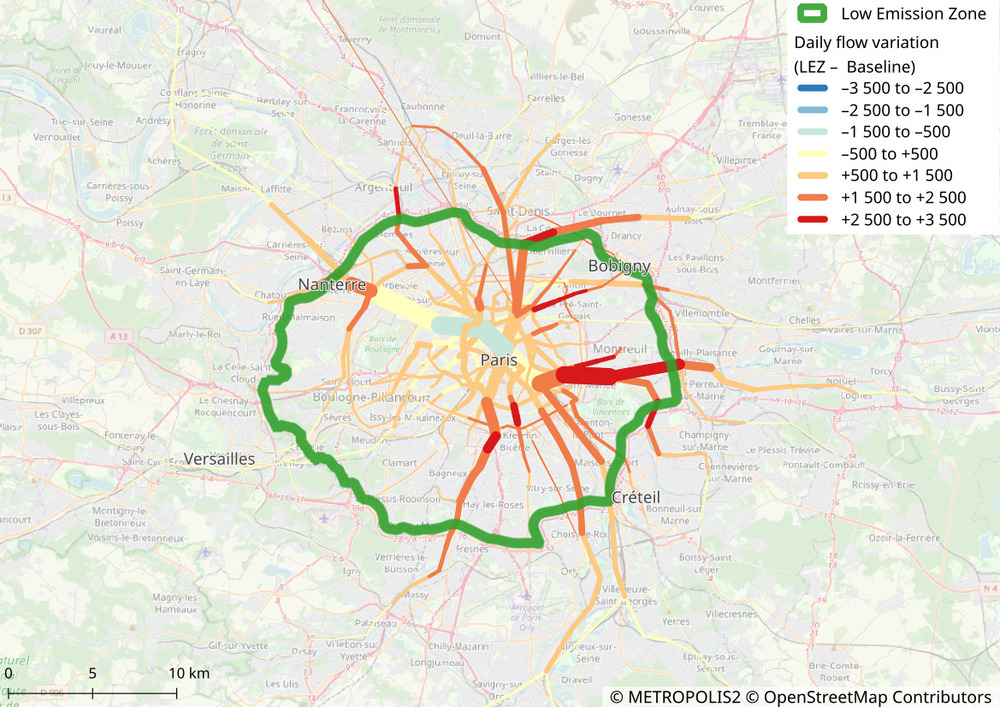
Road Congestion Impact
- Road congestion decreases on the main highways inside the LEZ (Boulevard Périphérique and A1 motorway)
- Little impact outside the LEZ
Public Transit Flows Impact
- Public transit mode share increases from 18.9% to 19.9%
- Larger flows on most legs, mainly in the surroundings of Paris (North, East and South)
- RER A: +1.2% passengers-kilometers
- RER B: +2.1% passengers-kilometers
- Tramway T7: +24.4% passengers-kilometers
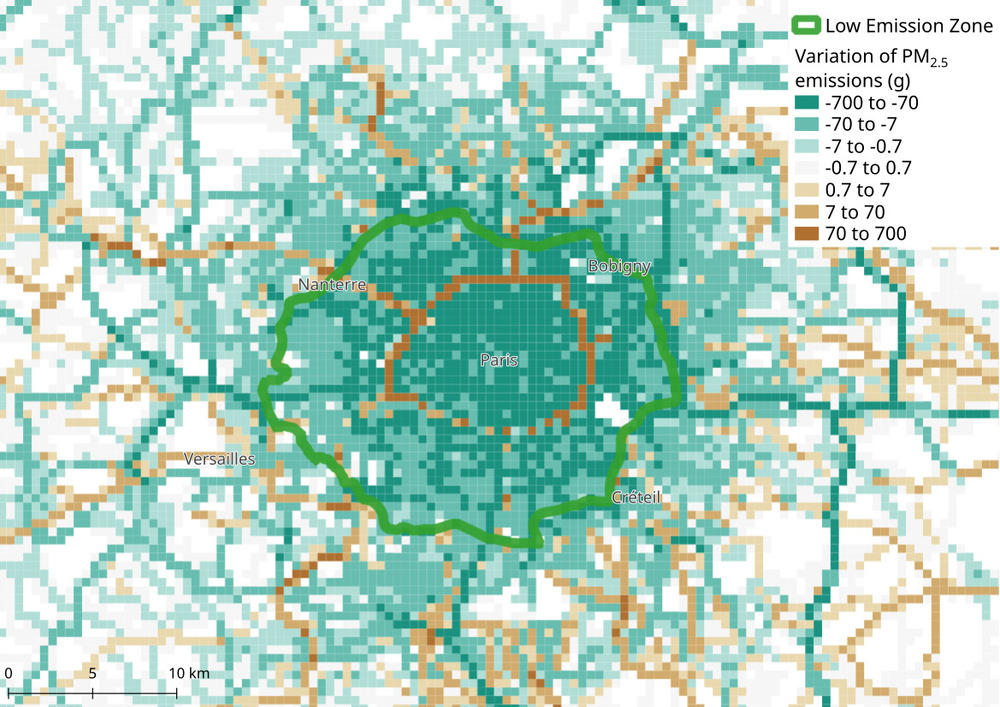
Pollutant Emissions
- Emissions of PM2.5 and NOx generated by road traffic are computed from the EMISENS model with COPERT emission factors
- Emissions depend on vehicles fuel type and age as well as instantaneous speed (link-level)
- Emissions decrease more inside the LEZ
|
Baseline |
LEZ |
Variation |
| PM2.5 emissions |
2.83 tons |
2.66 tons |
-6.0 % |
| NOx emissions |
33.32 tons |
30.45 tons |
-8.6 % |
| CO2 emissions |
21 730 tons |
20 829 tons |
-4.1 % |
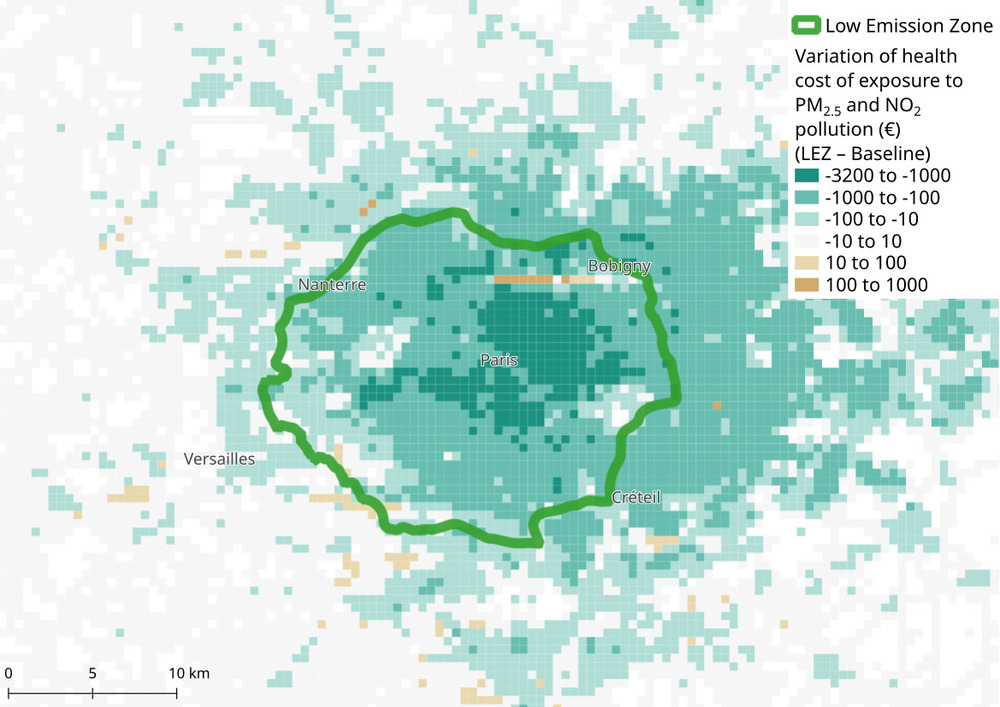
Population Exposure to Pollution
- Health impact is a function of the increase in mortality due to exposure to pollutants, given the concentration levels
- Exposure is computed based on the actual location of individuals in time and space
- Exposure decreases more near Paris (high concentration and high population density)
|
Baseline |
LEZ |
Variation |
| PM2.5 premature deaths |
5.9 |
5.3 |
-9.4 % |
| NOx premature deaths |
5.4 |
4.9 |
-10.1 % |
| Health surplus |
-12.537 M € |
-11.312 M € |
-9.8 % |
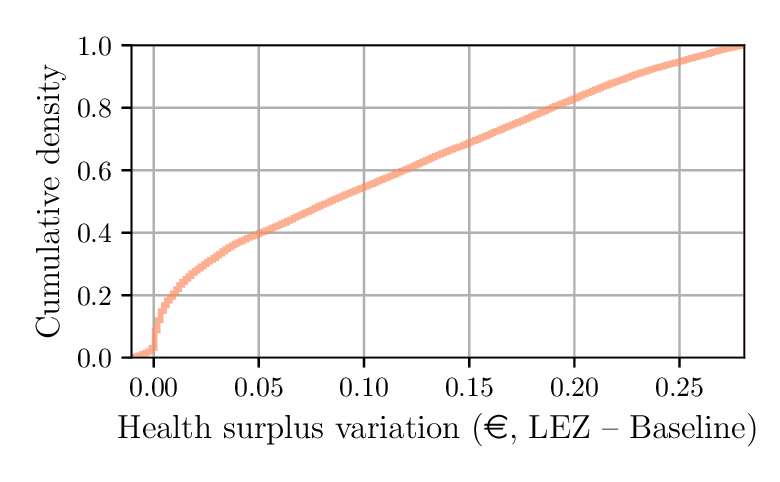
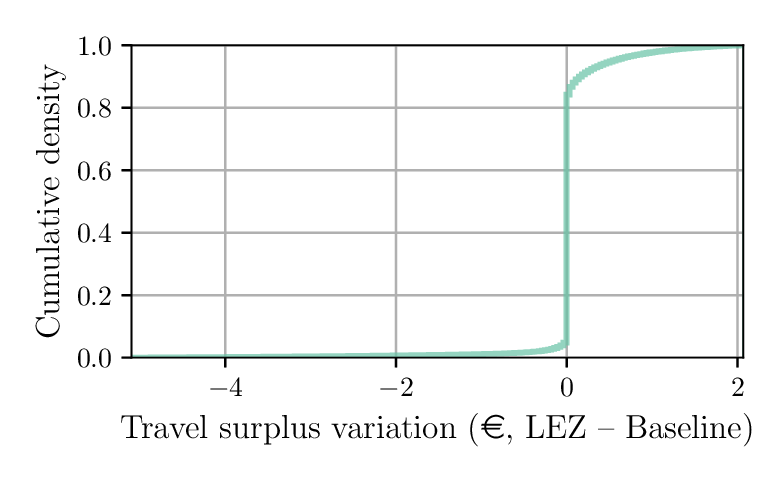
Heterogeneous Impacts
- Health impact: between 0 et +30 cents per day per individual
-
Travel impact:
- 93.2 % are not significantly impacted (variation smaller than 1 € daily)
- 3.5 % "win" more than 1 € daily
- 3.3 % "lose" more than 1 € daily
Winners and Losers Location
- "Winners" are spread over the region
- "Losers" are mainly living along the LEZ
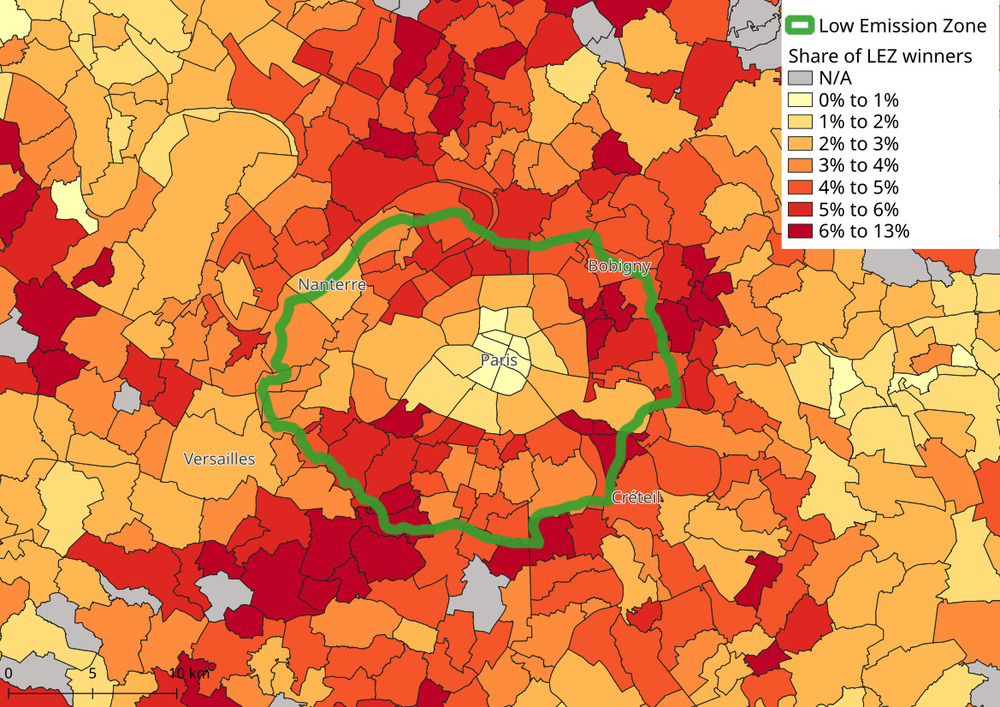
Winners
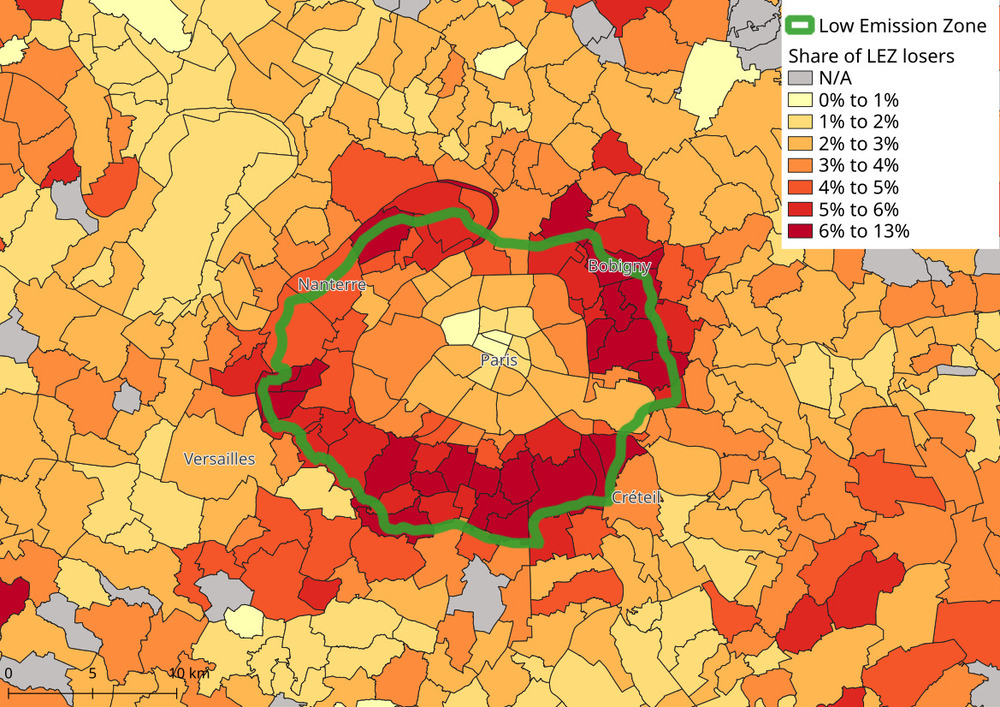
Losers
Winners and Losers Income
- Share of "winners" slightly increasing with the municipality average income
- Share of "losers" uncorrelated with the municipality average income
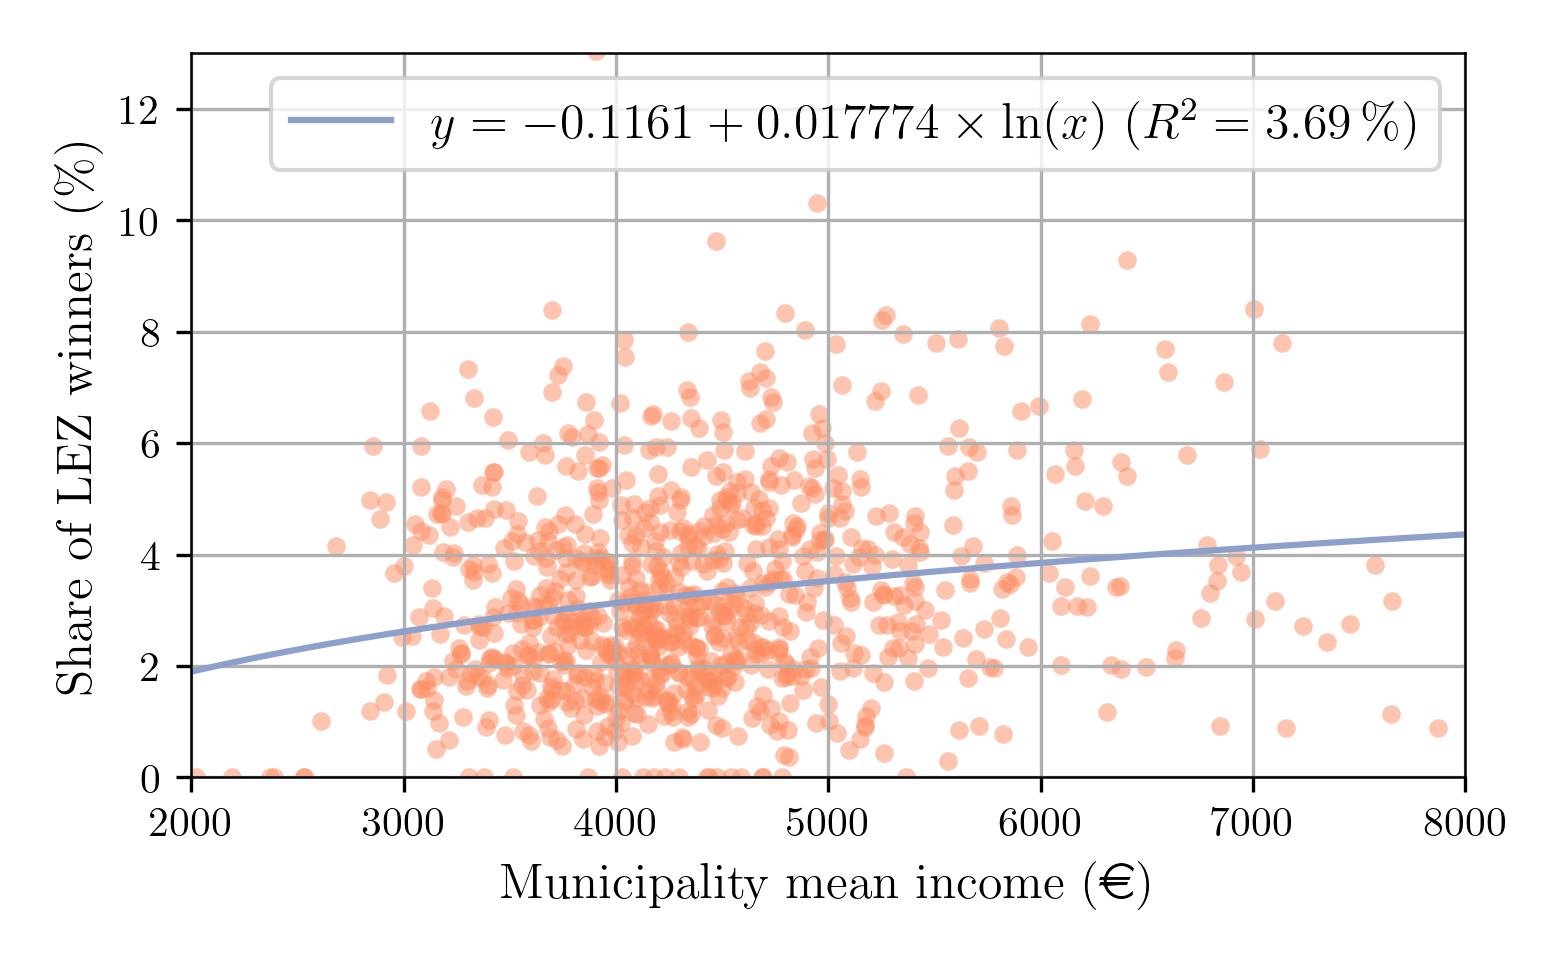
Winners
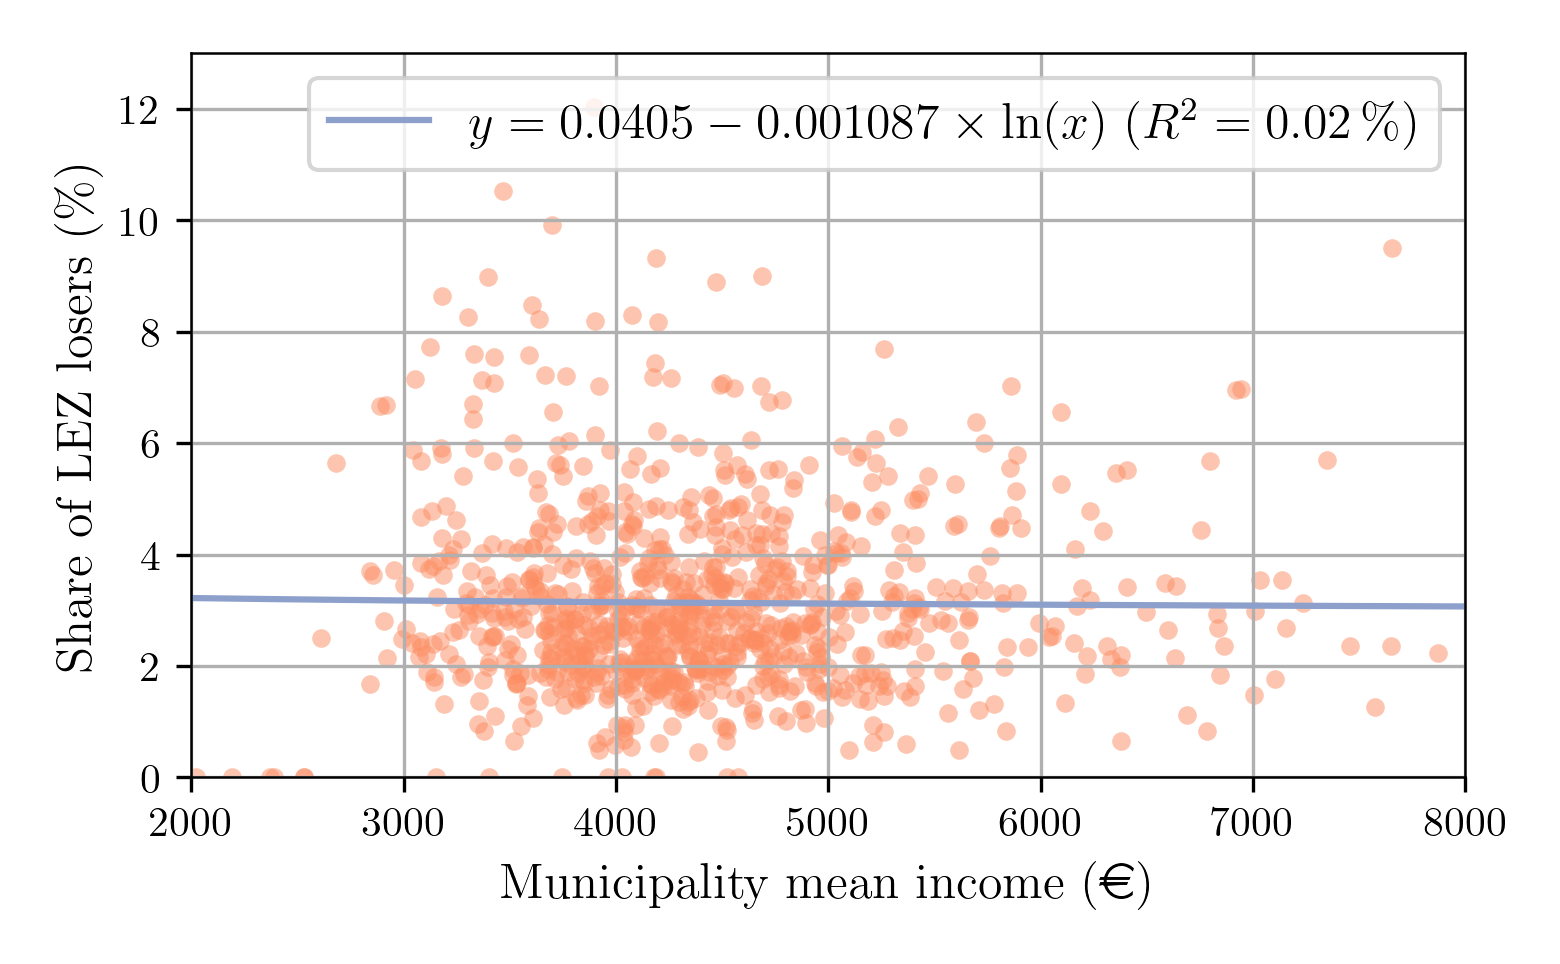
Losers
Conclusion
- Methodology for the evaluation of public policies with a transport simulator
- Global impact: decrease of car use, vehicle kilometers, congestion and pollution
- Individual impact:
- Health impact distributed evenly across the population
- Travel surplus impact shows great disparities
- Characteristics of the winners and losers of the policy
- Limits:
- No analysis of the income effect at the individual level
- Short-run analysis: no car-ownership model, no activity-based model, no location choice model
- Air pollution from public transit omitted