Impact of Low-Emission Zones on Spatial and Economic Inequalities using a Dynamic Transport Simulator
André de Palma, Lucas Javaudin
CY Cergy Paris Université
ISET Policy Institute – November 2023
Context
- In 2023, air pollution is estimated to have caused 311,000 premature deaths (European Environment Agency, 2022), representing a cost of 224 billion € or 1.4 % of GDP (using a statistical value of life of 700 k €)
- Air pollution is mainly caused by nitrogen oxides (NOx) and particulate matter (PM) emitted by road vehicles
- Popular instrument to improve air quality: Low Emission Zones (LEZ)
Low Emission Zones
- In Europe, LEZs have been implemented in hundreds of cities as of today
- Starting in 2025, LEZs will be mandatory for French cities above a pollution threshold
- Benefits of LEZs: reducing local (NOx, PM) and global (CO2) air pollution, congestion and noise pollution
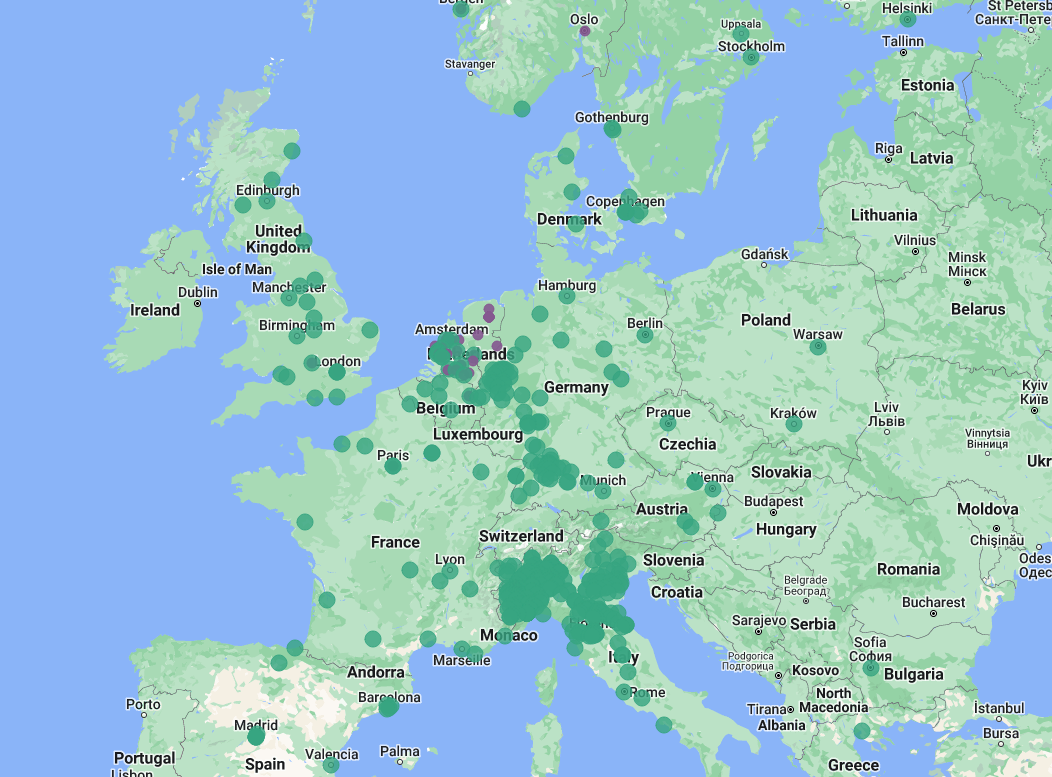
Green: Low-Emission Zone; purple: Zero-Emission Zones
Source: urbanaccessregulations.eu
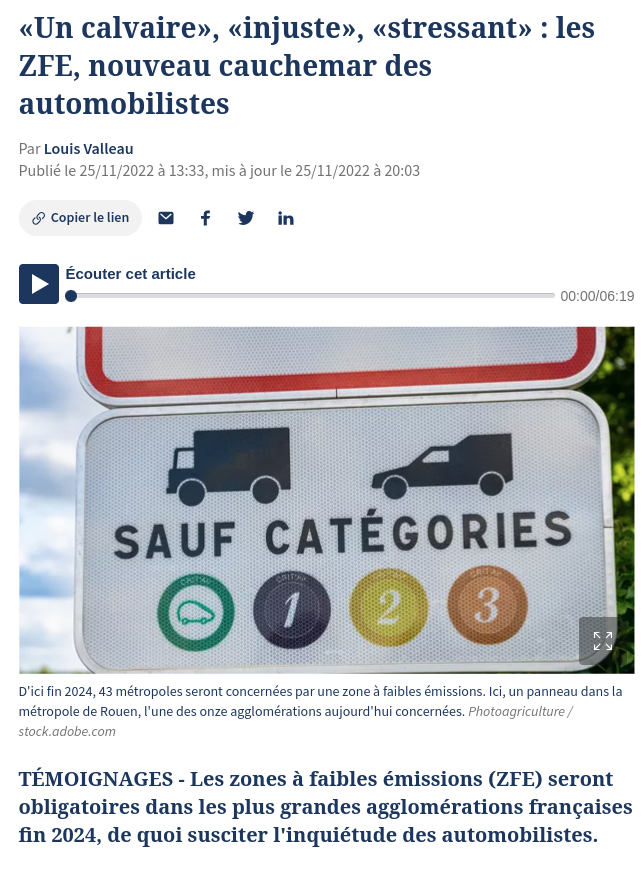
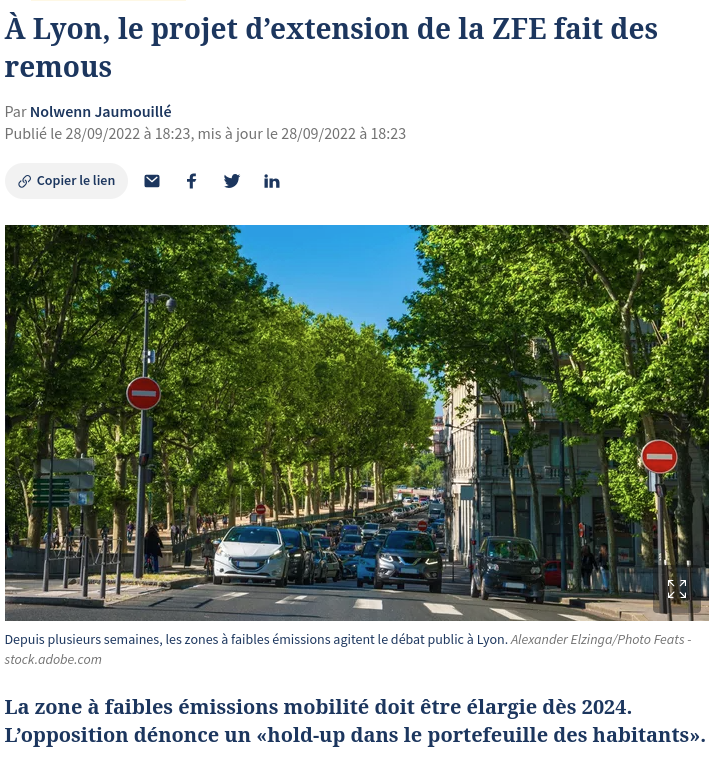
A Controversial Policy
"An ordeal", "unfair", "stressful": the LEZs, new nightmare for
the drivers
In Lyon, the project of extending the LEZ brings upheaval
Review
Arguments in favor of LEZ
- Improved air quality
- Decreased CO2 emissions
- Less noise pollution
- Less congestion
Arguments againt LEZ
- Restriction of freedom
- Unfair: penalize people stuck with an old vehicle (poor and rural households)
- Some drivers might make a detour around the LEZ, polluting even more
- Drivers are induced to purchase new vehicles before their end-of-life
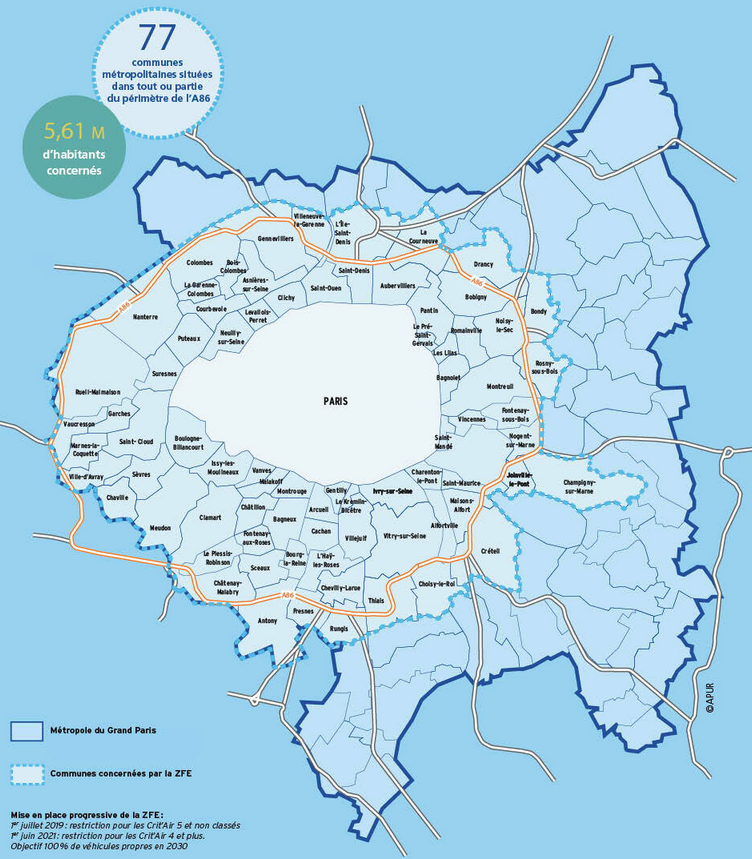
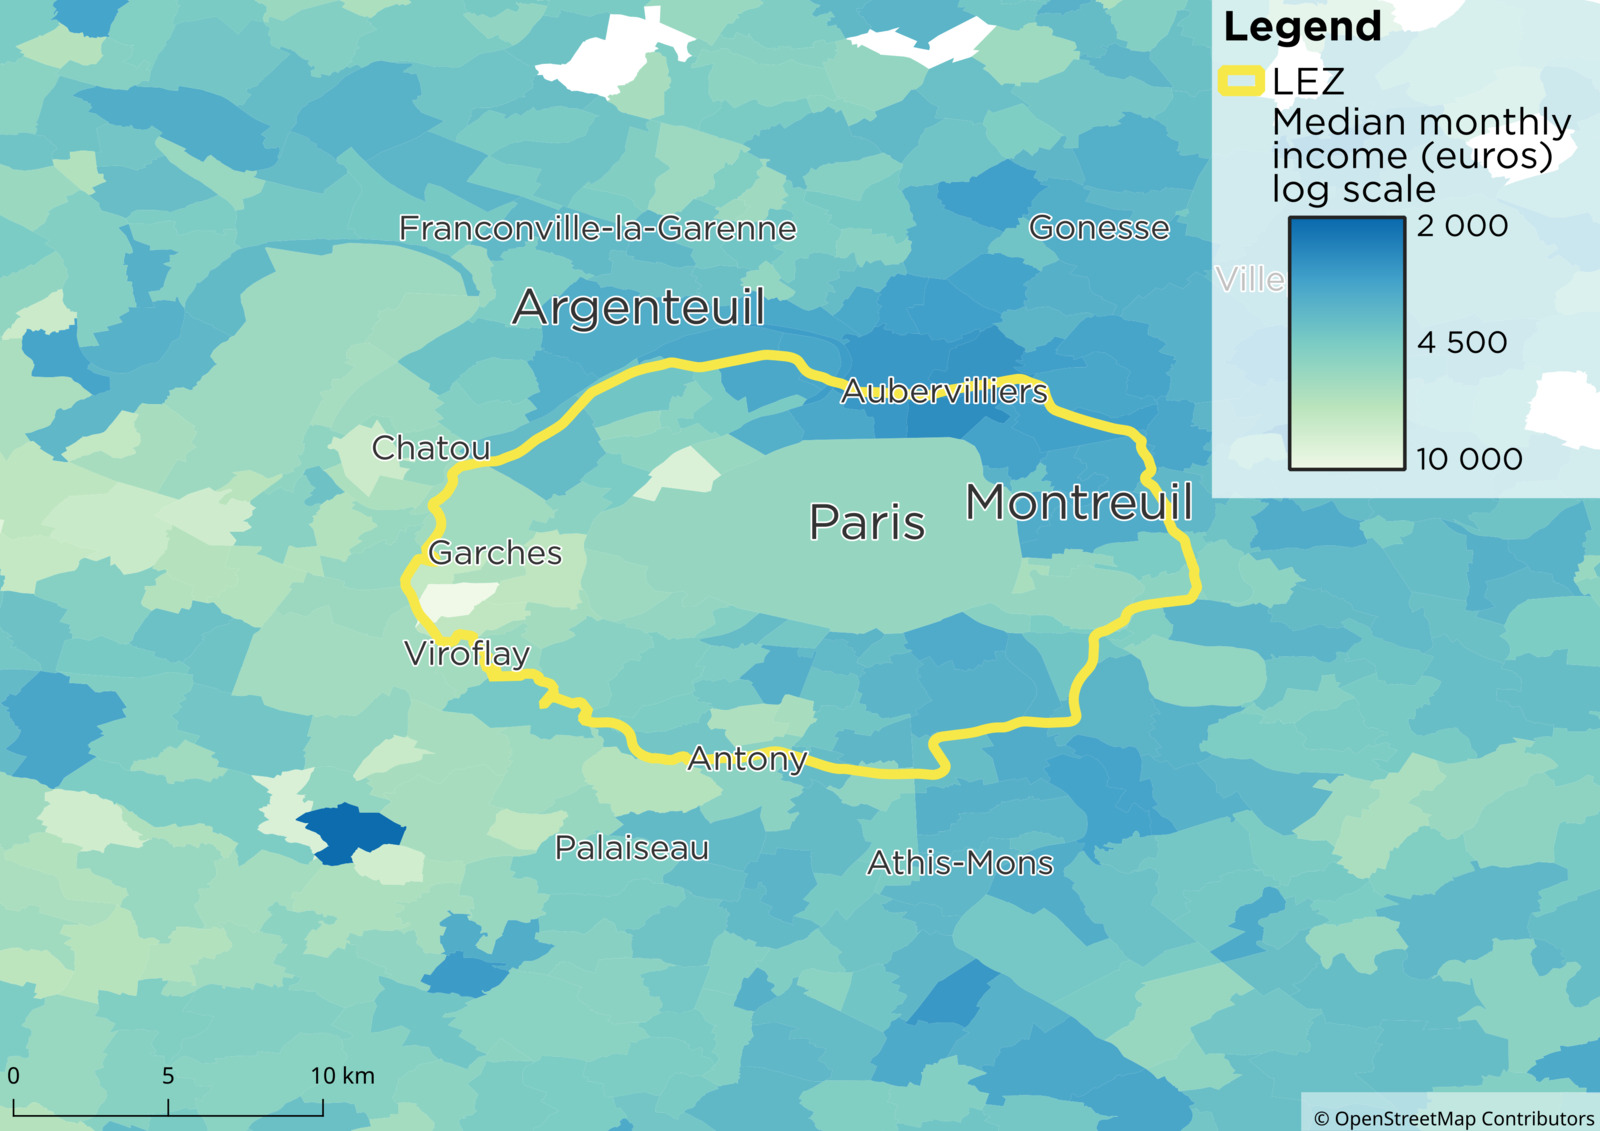
Paris' Low Emission Zone
- More than 5 million inhabintants are living in the LEZ
- The LEZ represent around 10 % of the Île-de-France's road network
- June 2021: Crit'air 4 vehicles and worse are banned (11 % of the fleet)
- January 2025: Crit'air 3 vehicles and worse are banned (32 % of the fleet)
- 68 € fine for non-respect (traffic-camera ticketing is planned)

Crit'air Classes
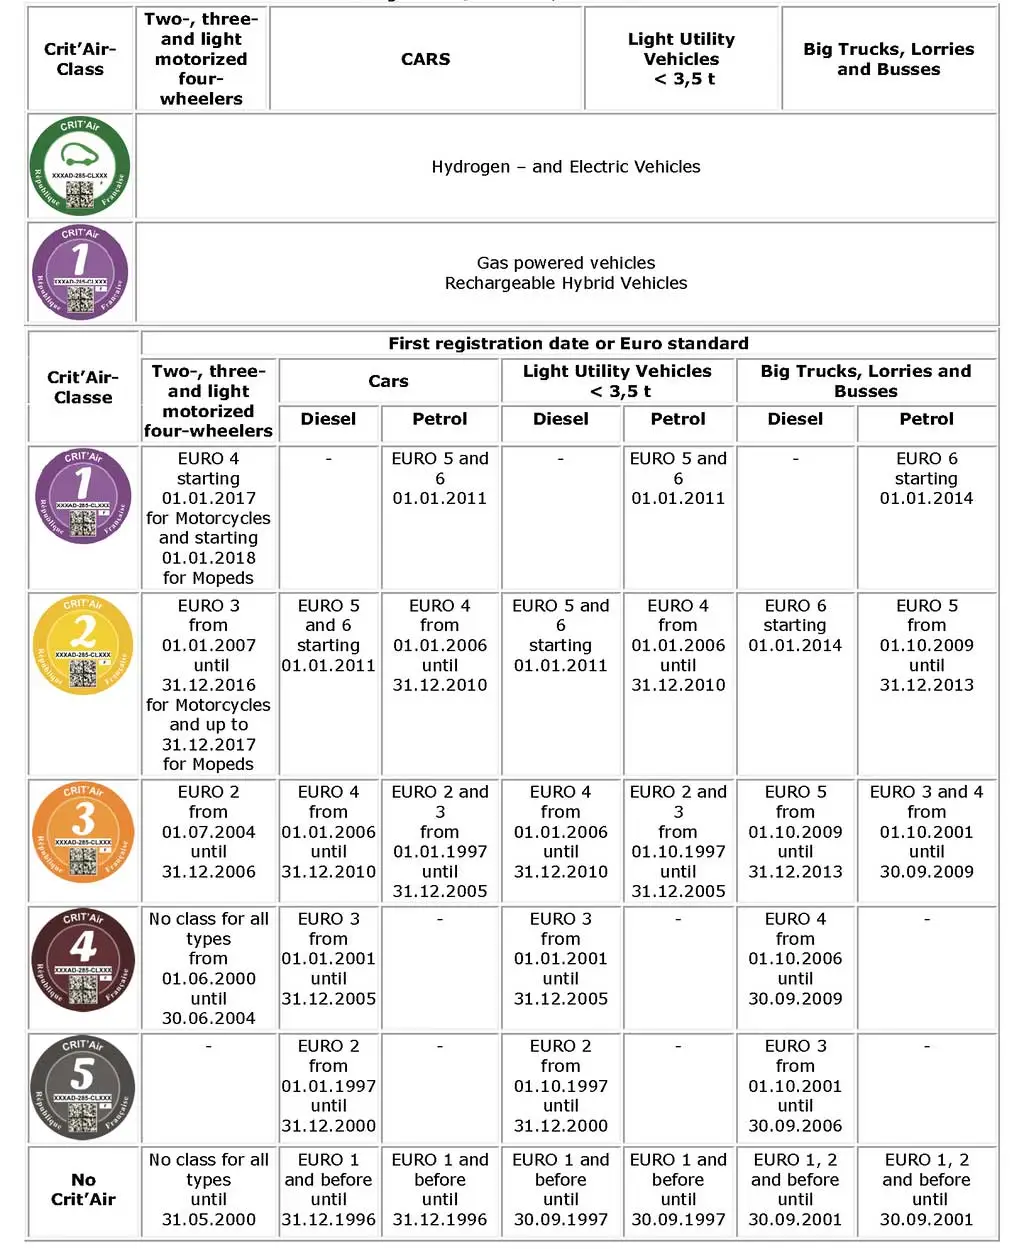
| Crit'air | Share (France, 2019) |
Mean income decile (France, 2019) |
|---|---|---|
| E | 0.3 % | 7.74 |
| 1 | 15.7 % | 6.94 |
| 2 | 34.7 % | 7.10 |
| 3 | 27.1 % | 6.21 |
| 4 | 11.6 % | 5.83 |
| 5 | 3.7 % | 5.56 |
Research Questions
- What is the impact of the Low Emission Zone of the Métropole du Grand Paris on global surplus?
- Which people are winning and losing from the Low Emission Zone (based on home location and income)?
The research is conducted using Metropolis, an agent-based, mesoscopic and dynamic transport simulator, based on utility maximation. A new version has been developed to handle different vehicle types and road restrictions.
Literature Review
Impact of Low Emission Zones:
Agent-based transport simulators:
- Empirical evaluation: focus on environmental impact, ambiguous effect (Holman et al., 2015; Wolff, 2014; Margaryan, 2021)
-
Ex-ante evaluation:
- Carslaw and Beevers (2002): approached based on traffic flow data, using an emission and dilution model
- Dias et al. (2016): macroscopic transport model
- de Bok el al. (2022): agent-based model, focus on freight transport
- These studies do not find a large positive impact of Low Emission Zones.
Agent-based transport simulators:
- MATSim (Axhausen et al., 2016): activity-based, behavior-oriented
- SimMobility (Adnan et al., 2016): activity-based, hierarchical discrete choice modeling
Outline
- Presentation of the transport simulator Metropolis
- Application to Paris' urban area
- Preliminary results: aggregate results, winners and losers from the LEZ
Introduction
-
Scope:
- Île-de-France
- 3AM to 10 AM
- Three modes: car, public transit, walk
- All purposes
- Representative working day
- Scenario 2025: vehicles Crit'air 3 and worse are banned (32 % of the fleet)
-
Limits:
- No car-ownership model (short-term analysis)
- Trucks are not considered
- Time restrictions are not taken into account
- Cheating and exceptions are not considered
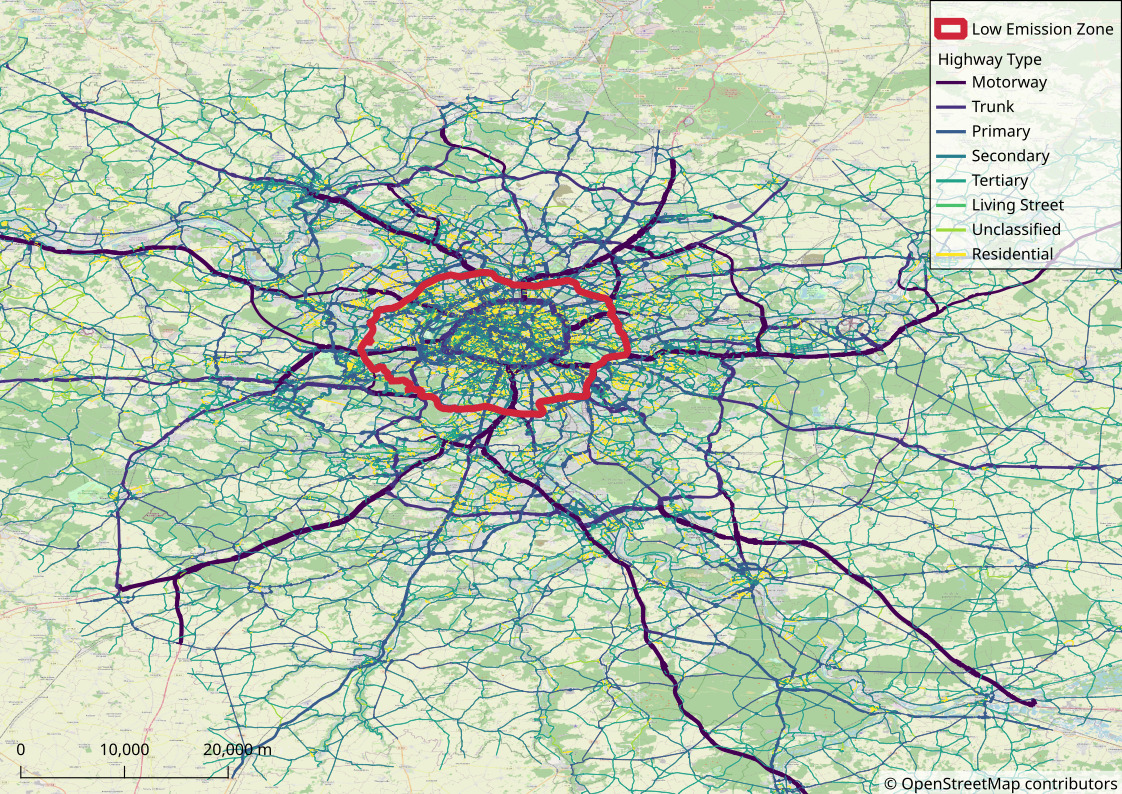
Input: Road network
- Source: OpenStreetMap
- Highway types: motorway, trunk, primary, secondary, tertiary, living street, unclassified and residential
- Living streets, unclassified and residential roads are discarded when not used
- Final network has 40 852 km of roads (out of 91 859 km in the full network)
Input: Population
- Generation of a synthetic population using Hörl and Balac (2021)
- Data sources: INSEE census, household travel survey, FiLoSoFi (household income), BD-TOPO (buildings data), SIRENE (entreprise census) and BPE (service and facility census)
- Simulated household-level characteristics: car availability, bike availability, income
-
Simulated individual-level characteristics:
- all activities performed during a day (home, work, education, leisure, shopping, other) with the activity duration and exact location
- age, employment status, sex, socio-professional category, driving license, public-transit subscription
- Final population: 629k agents, with 819k trips (population and capacities are scaled down to 10 %)
LEZ Scenarios
-
Scenarios:
- No-LEZ simulation: Simulation without the Low Emission Zone
- LEZ-2025 simulation: Crit'air 3, 4 and 5 are forbidden (24 % of agents, 32 % of car owners)
-
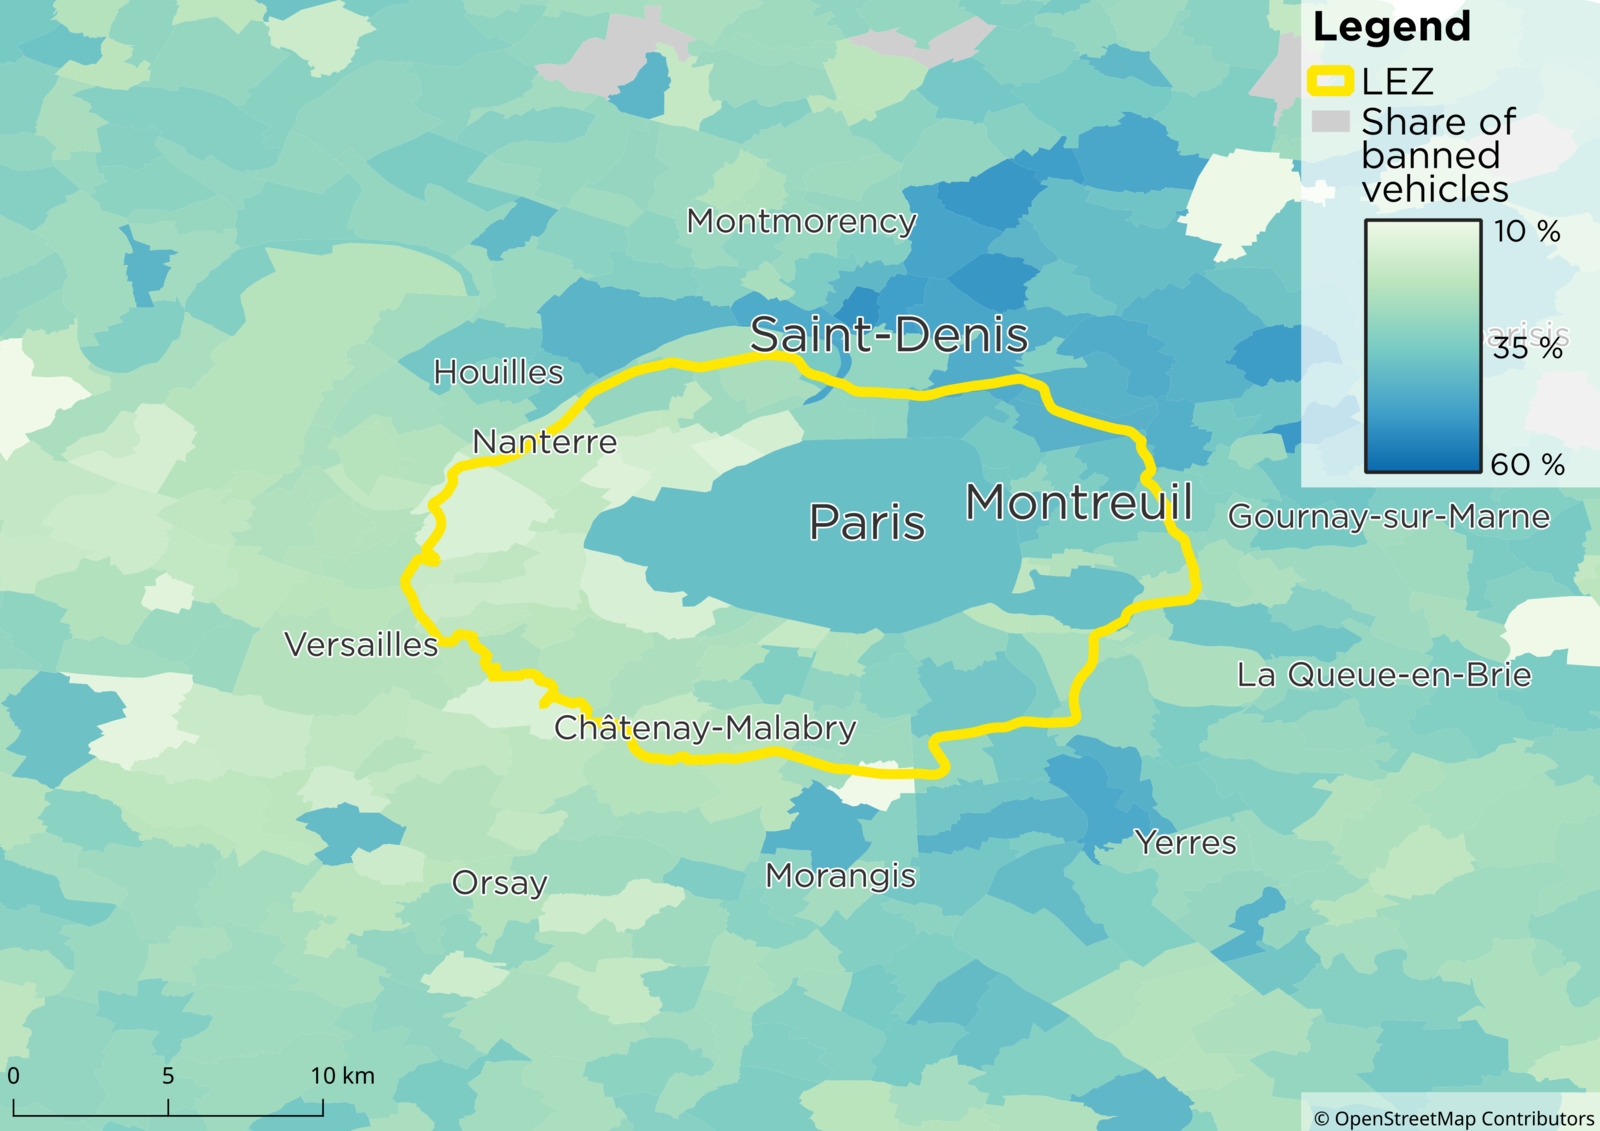
Generating vehicle types:
- Data: Statistics on the vehicle fleet at the municipality level from the French Ministry of Transport (2021)
- A vehicle is randomly drawn for each agent based on the vehicle fleet from his / her home municipality
Share of banned vehicles
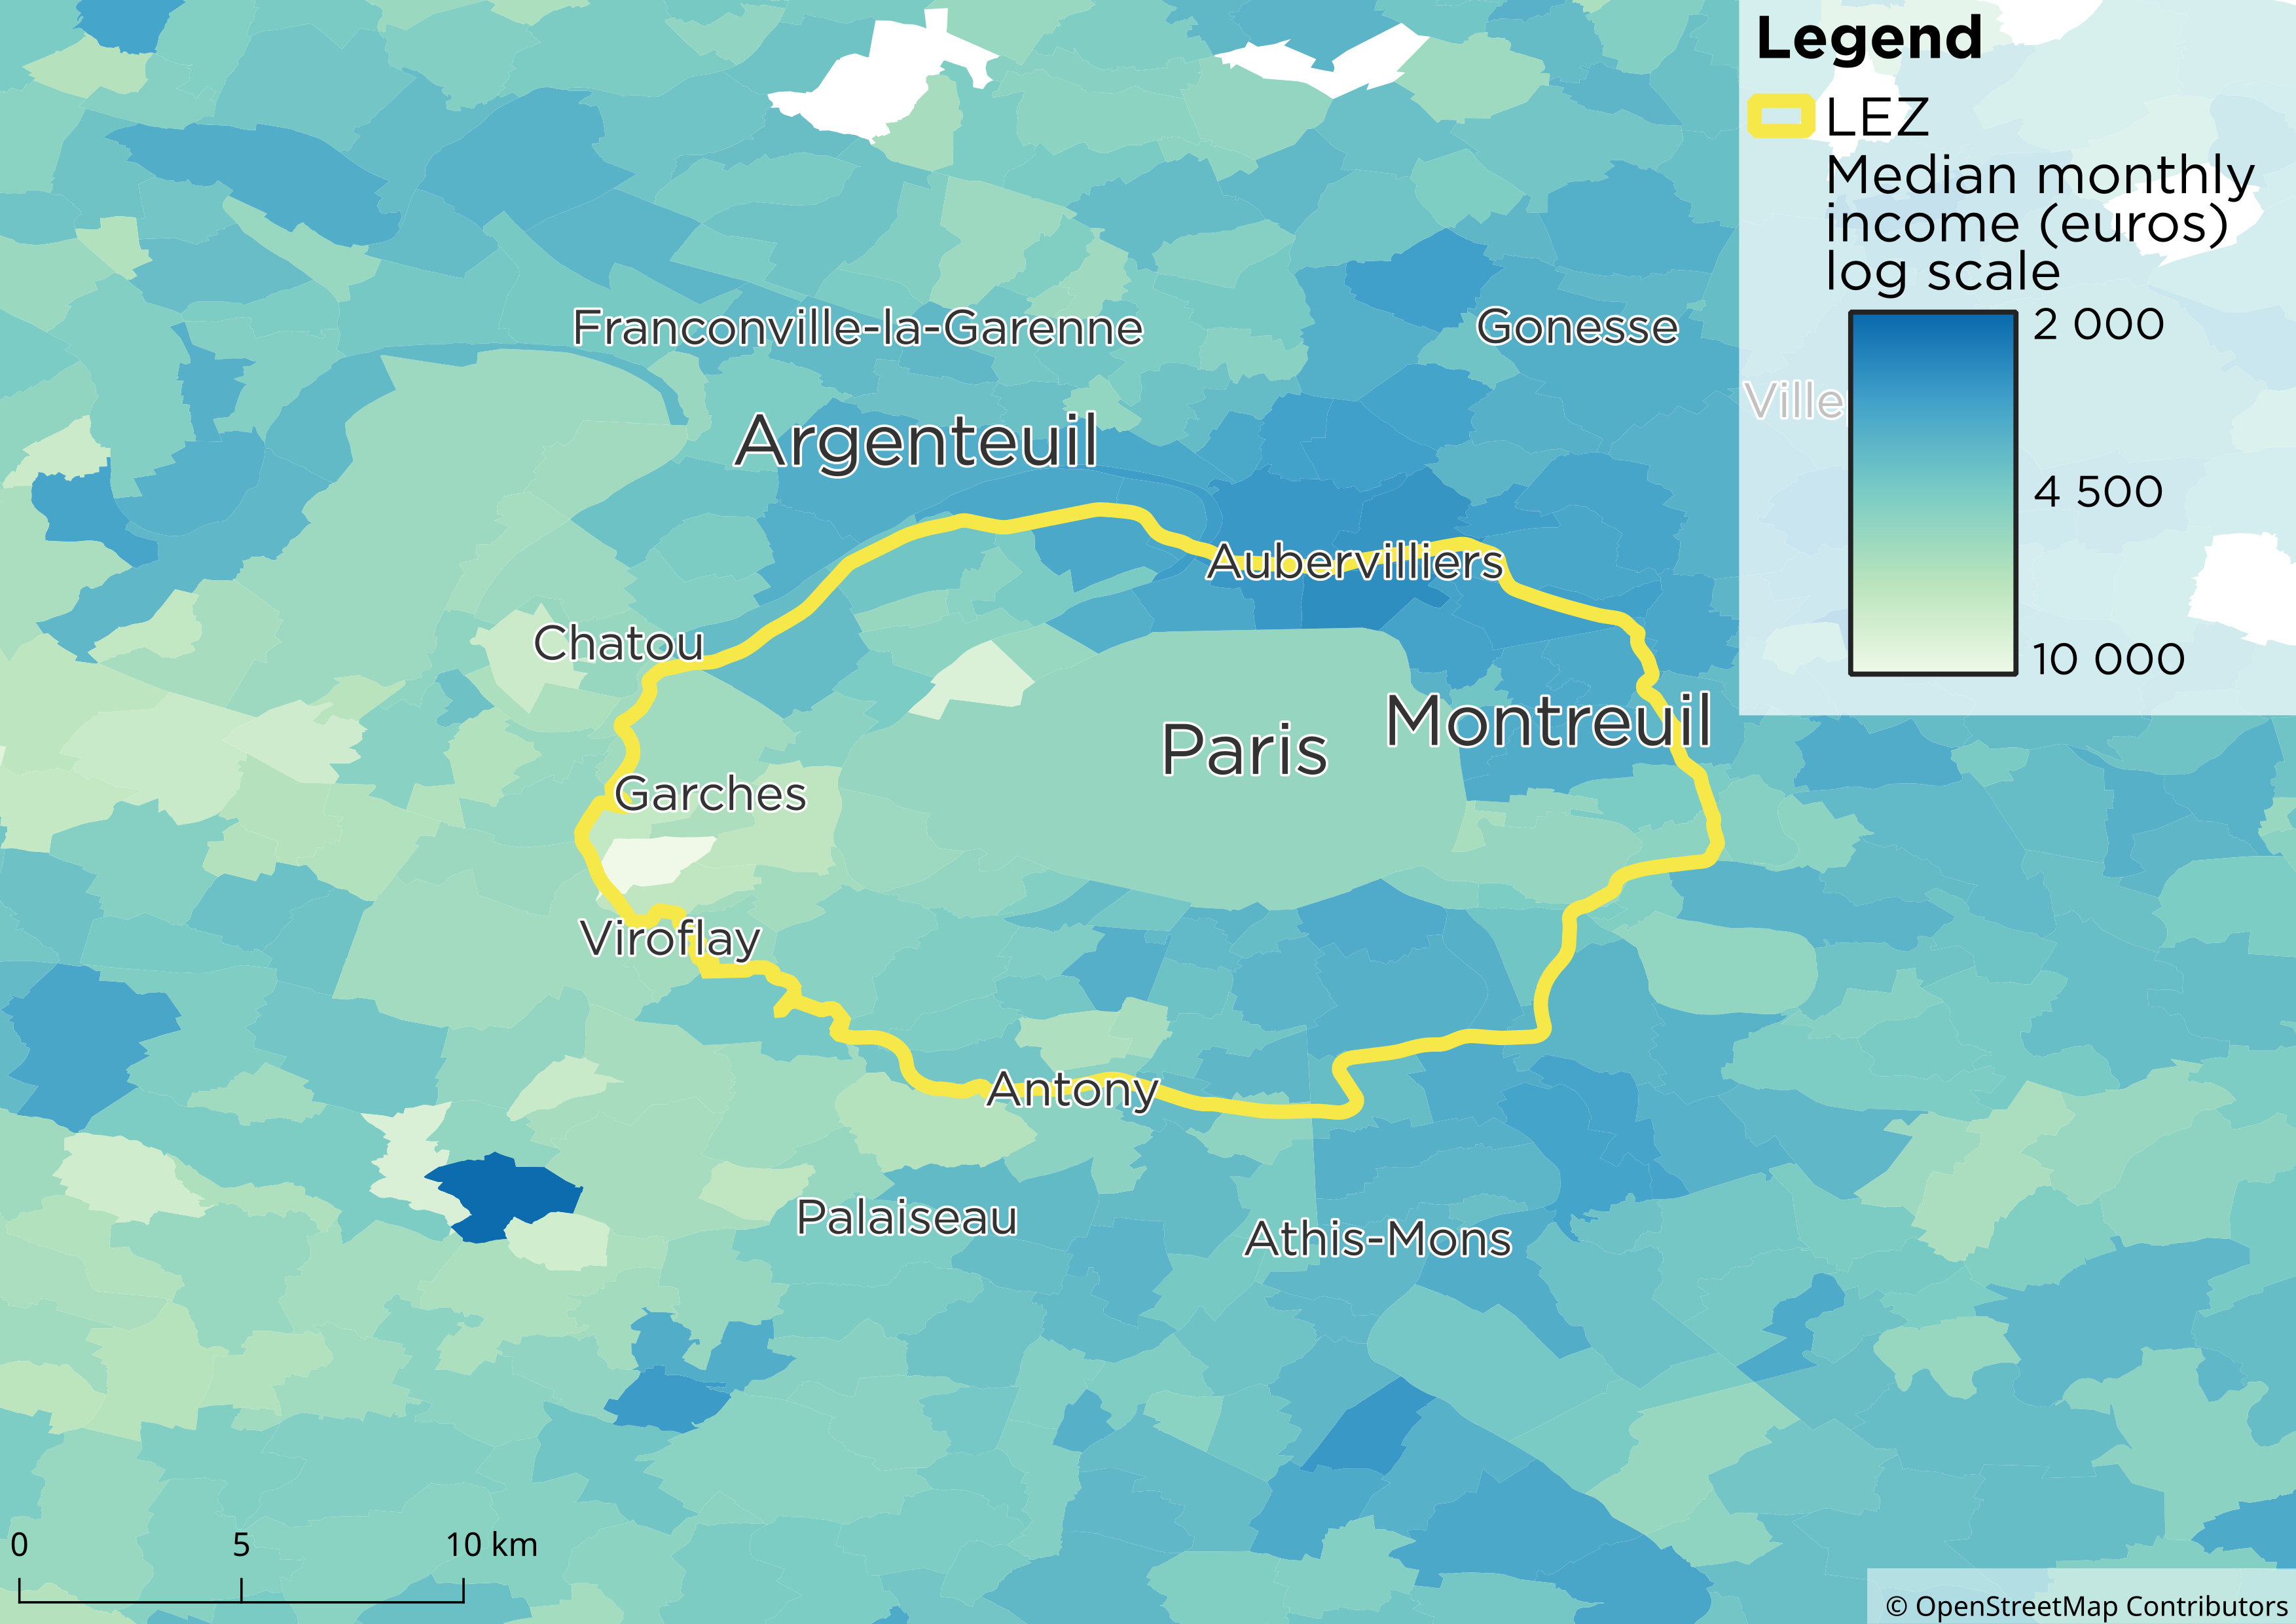
Median monthly income
Basic Principle
- Metropolis is an iterative model
- At each iteration, three models are run successively (pre-day model, within-day model and day-to-day model)
- The simulation stops when a convergence criteria is met or when the maximum number of iterations is reached

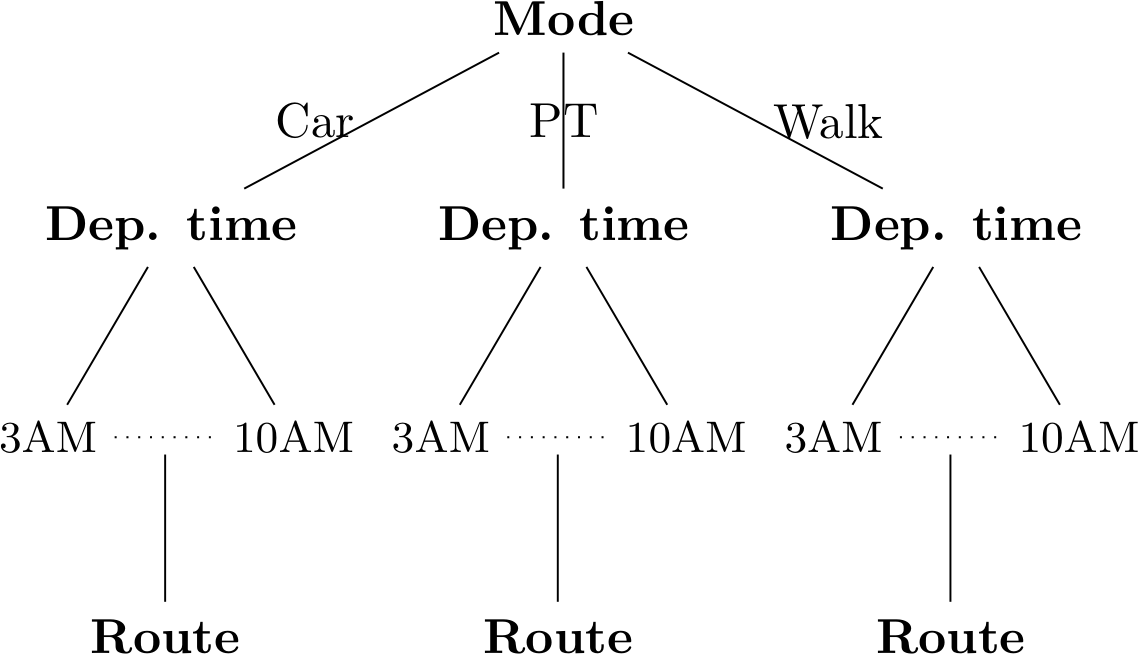
Pre-Day Model
- Input: time-dependent travel-time function for each road of the road network
- Output: Mode, departure-time and route for each agent
- Mode choice: Multinomial Logit model
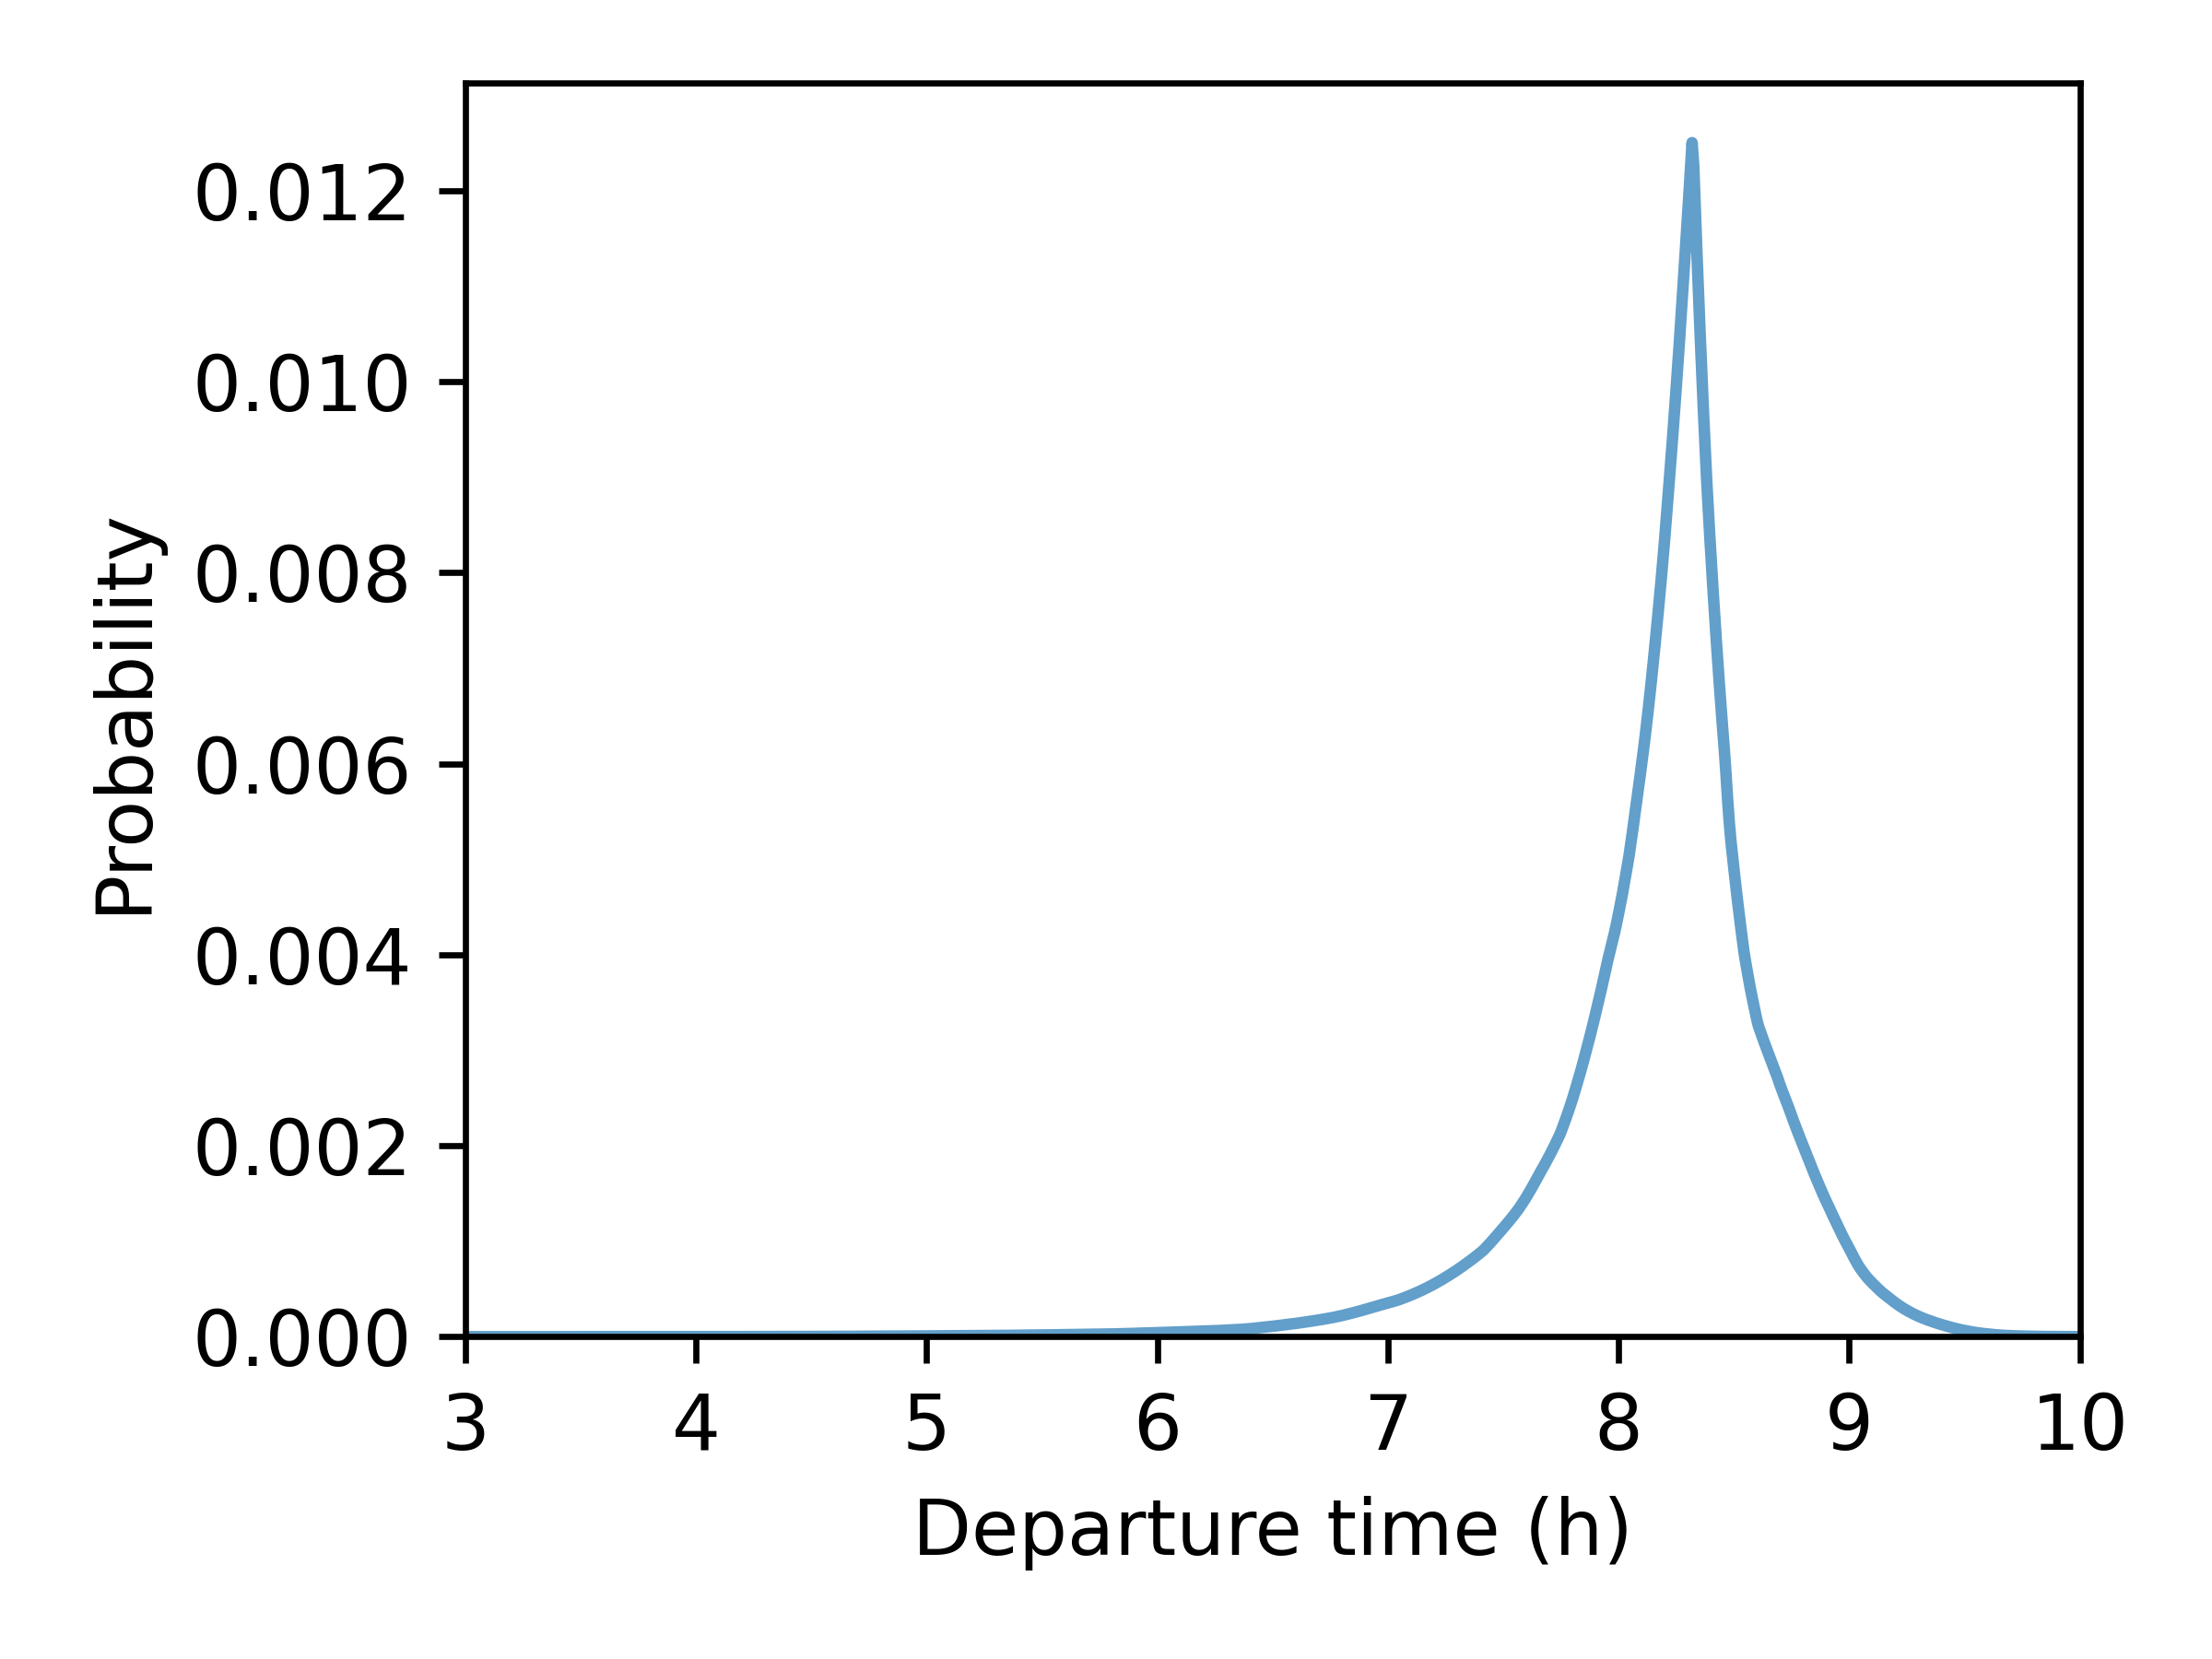
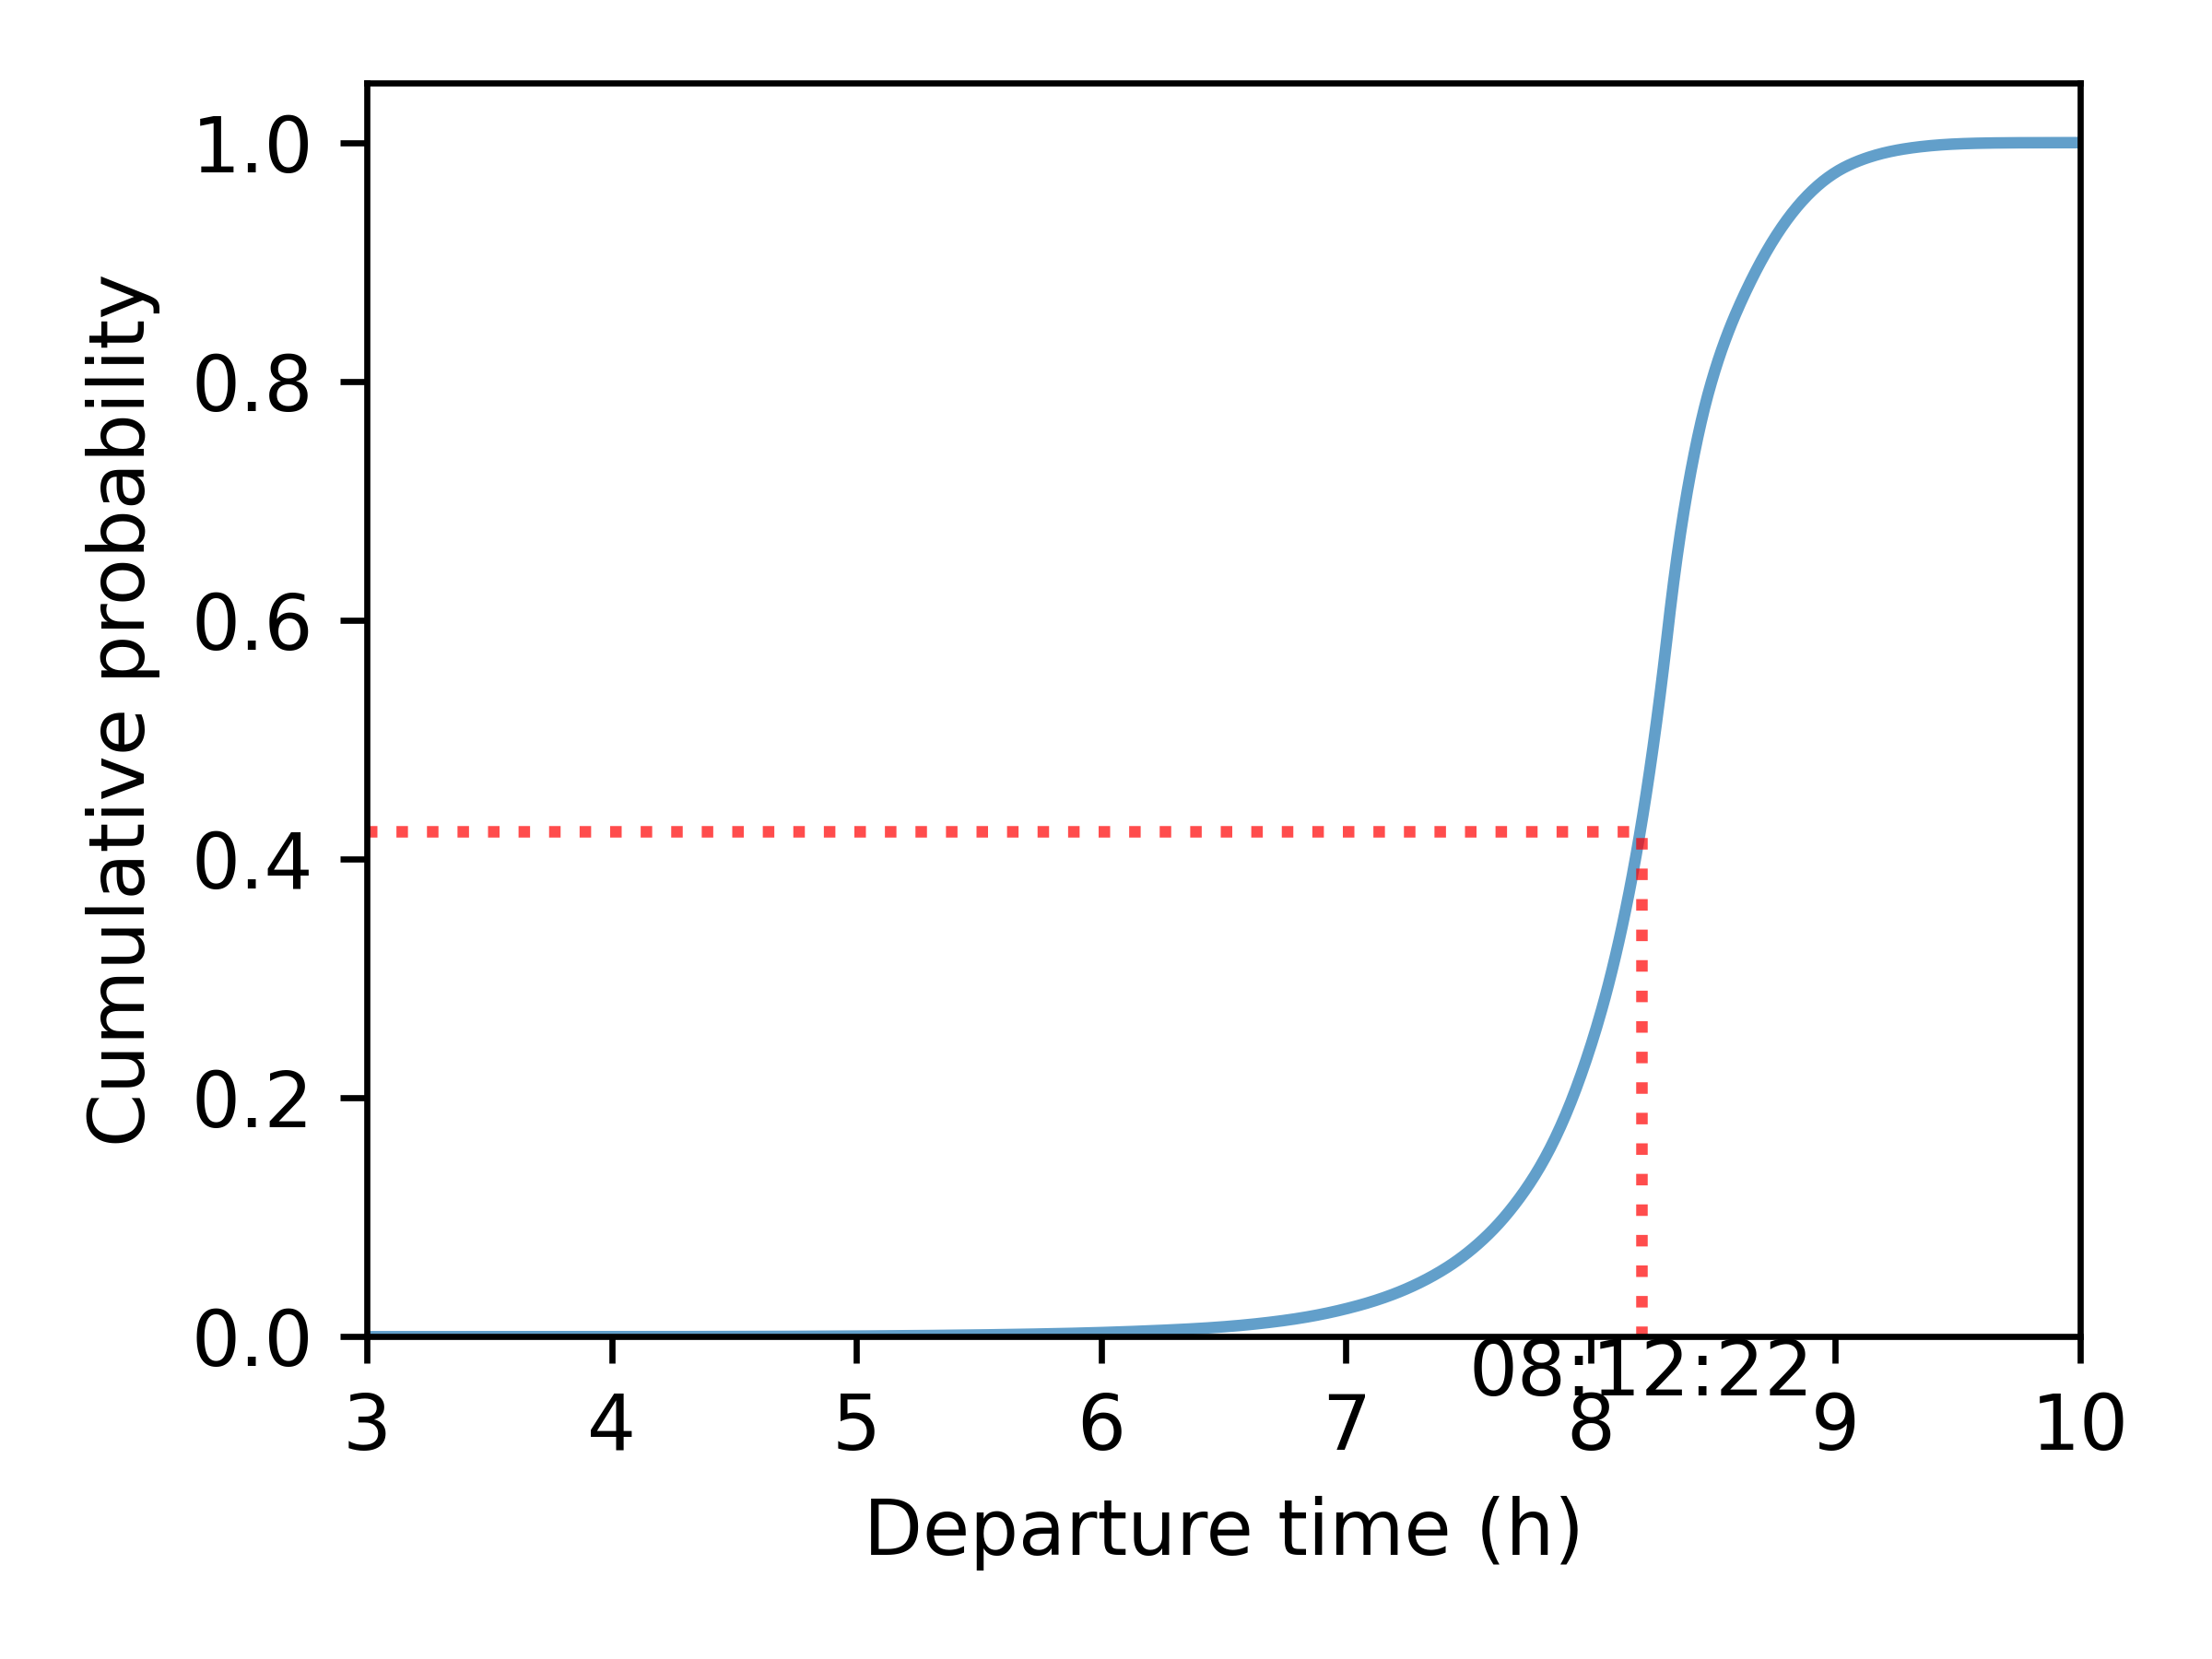
- Departure-time choice: Continuous Logit Model
- Route: time-dependent Contraction Hierarchies
Pre-Day Model
- Input: time-dependent travel-time function for each road of the road network
- Output: Mode, departure-time and route for each agent
- Mode choice: Multinomial Logit model
- Departure-time choice: Continuous Logit Model
- Route: time-dependent Contraction Hierarchies
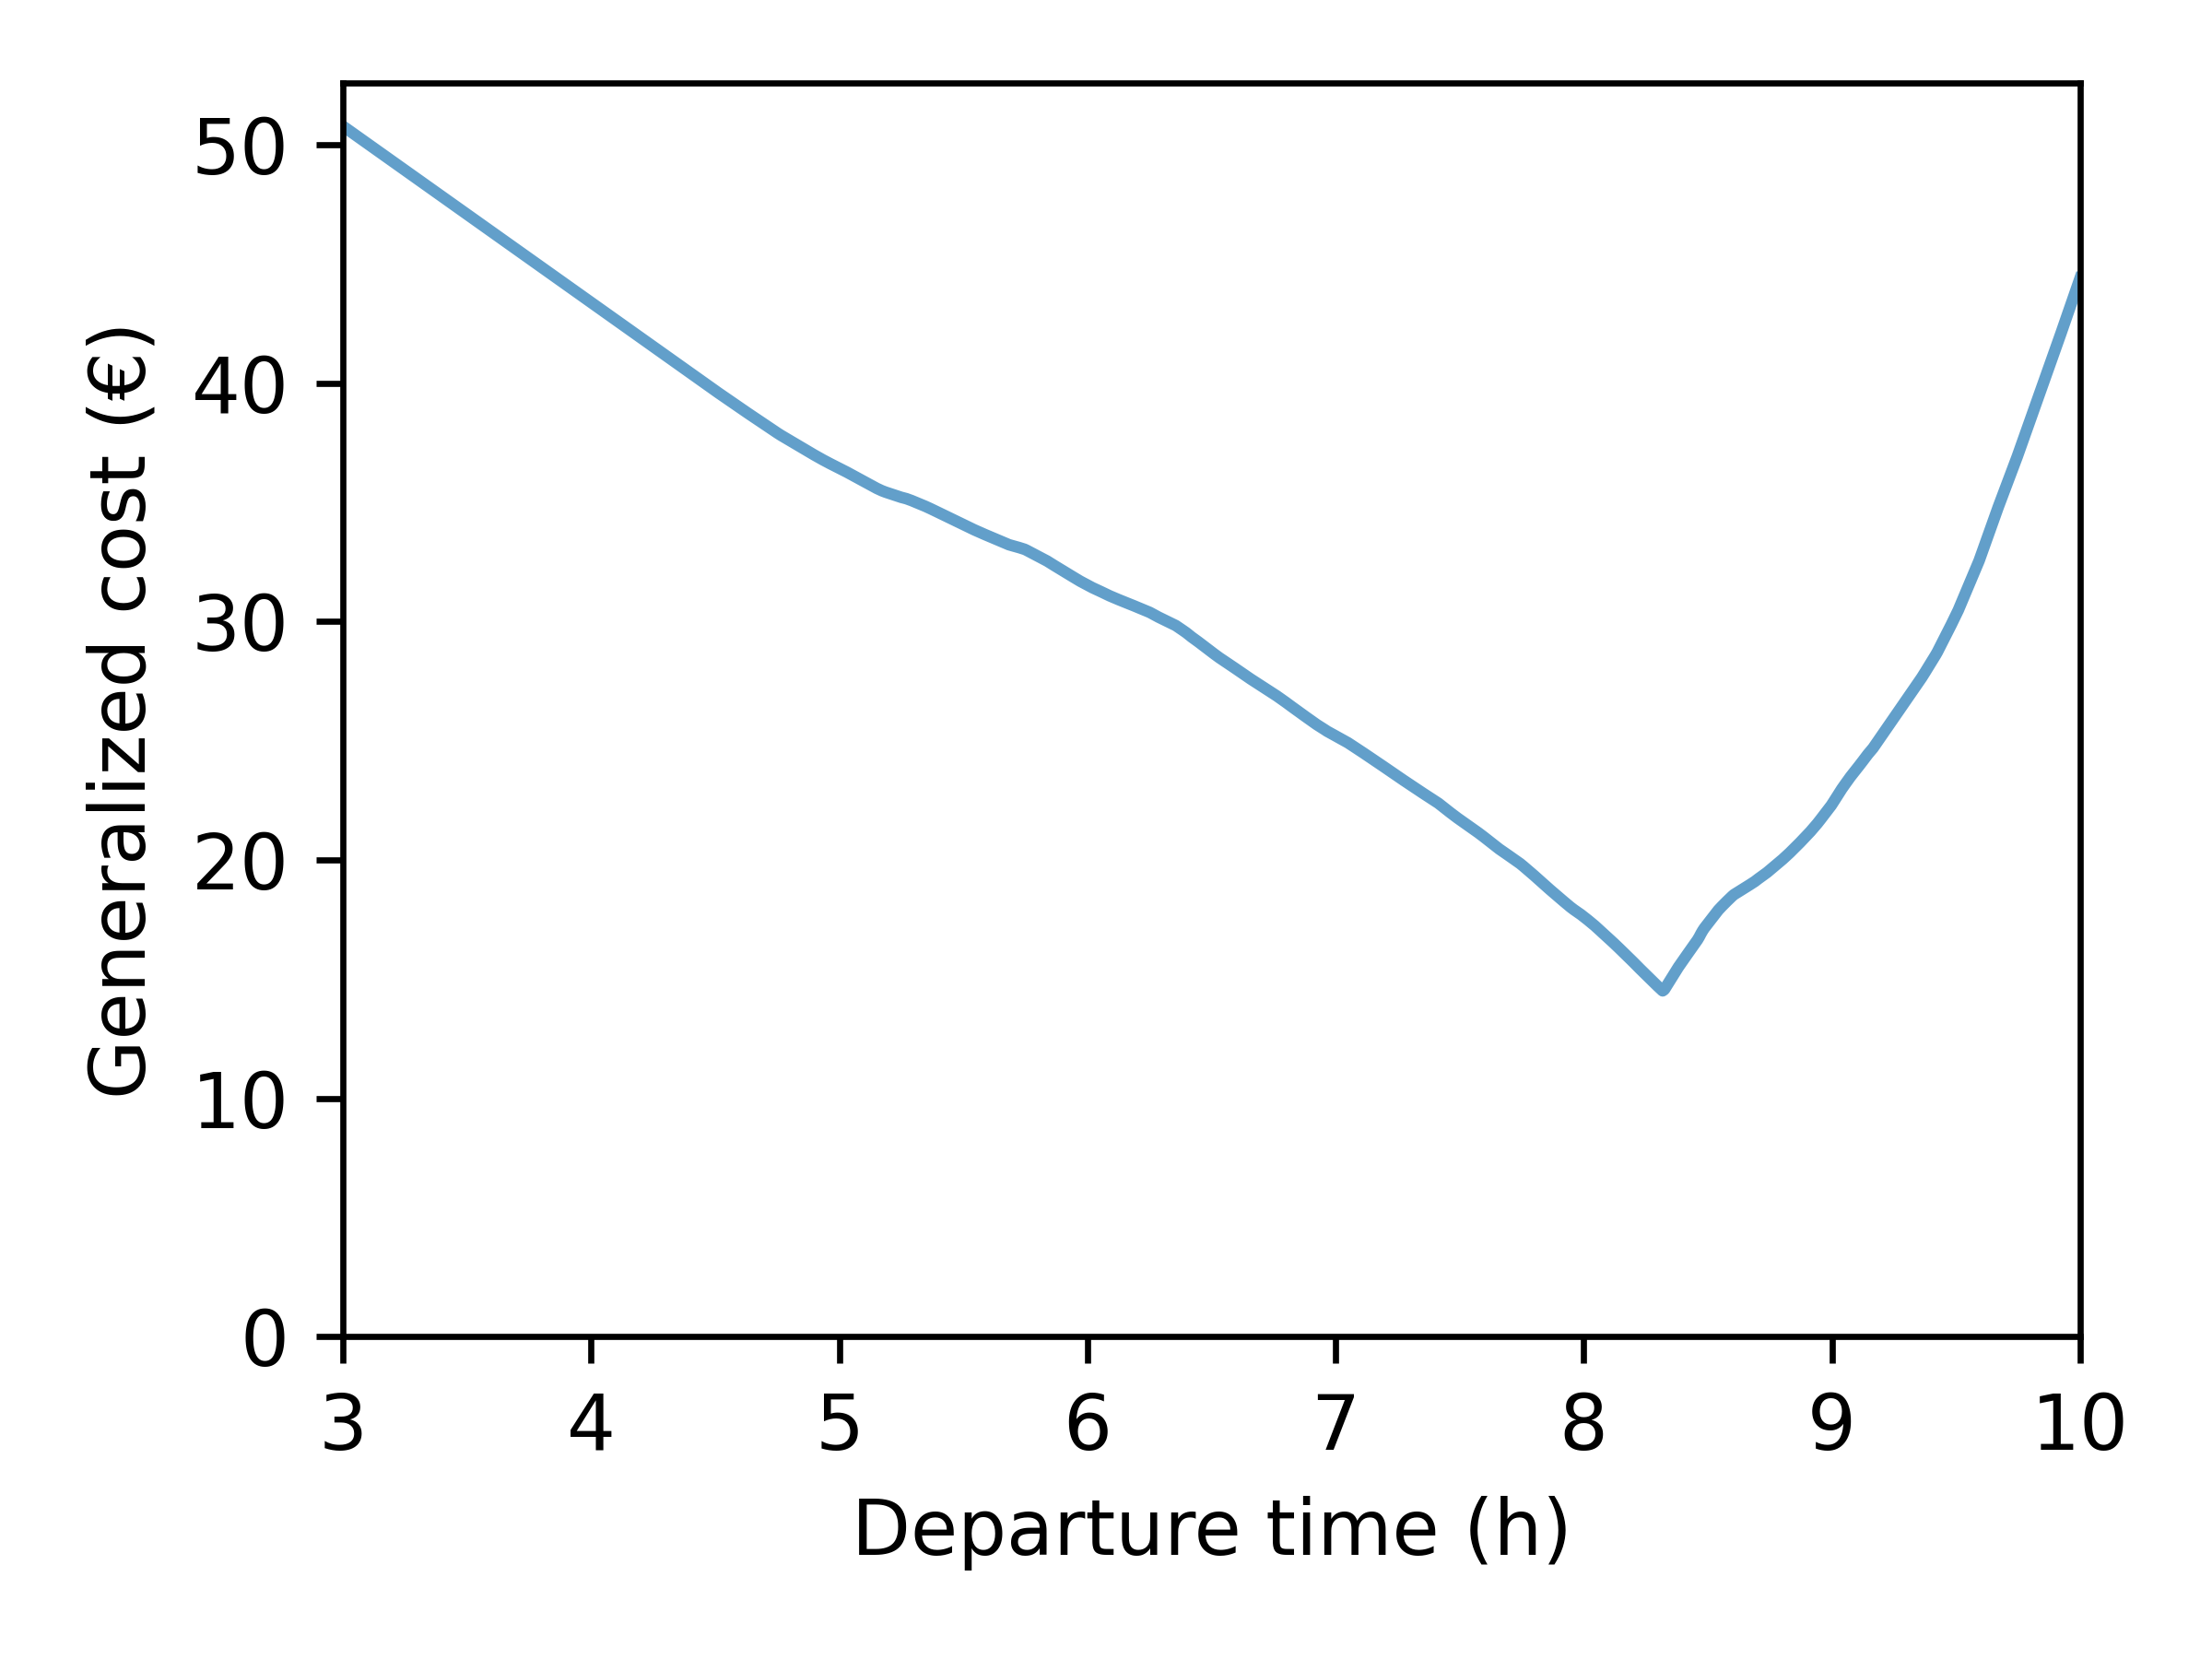
A trip generalized cost is (\( \alpha-\beta-\gamma \)
model: Vickrey, 1969, Arnott, de Palma, Lindsey, 1990) \[
\begin{align*} c(t_d, t_a) =& \underbrace{\alpha \cdot (t_a -
t_d)}_{\text{travel cost}} \\&+ \underbrace{\beta \cdot [t^* -
t_a]_+ + \gamma \cdot [t_a - t^*]_+}_{\text{schedule-delay cost}}
\end{align*} \]
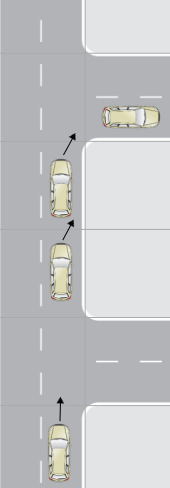
Within-Day Model
- Input: Chosen mode, departure time and route of each agent
- Event-based model: Events represent an agent's or vehicle's action; they are simulated in a chronological order
- Congestion model: combination of speed-density functions, bottlenecks and queue propagation
- Output: Edges' travel-time functions
Day-to-Day Model
- Input: Expected and simulated edges' travel-time functions
- Learning process based on Markov decision processes
- Output: Expected edges' travel-time functions for next iteration
\[ {tt}^e_{\tau + 1} = \lambda \cdot {tt}^e_{\tau} + (1 - \lambda)
\cdot {tt}^s_{\tau} \]
Results
Aggregate Results
| No LEZ | LEZ-2025 | Variation | |
|---|---|---|---|
| Car users | 2.101 M | 1.883 M | -10.4 % |
| Vehicle kilometers | 31.04 M km | 28.23 M km | -9.0 % |
| Travel time | 29'24'' | 30'8'' | +2.4 % |
| Congestion index | 29.40 % | 24.56 % | -16.5 % |
| Average surplus | 7.37 € | 7.25 € | -0.09 € |
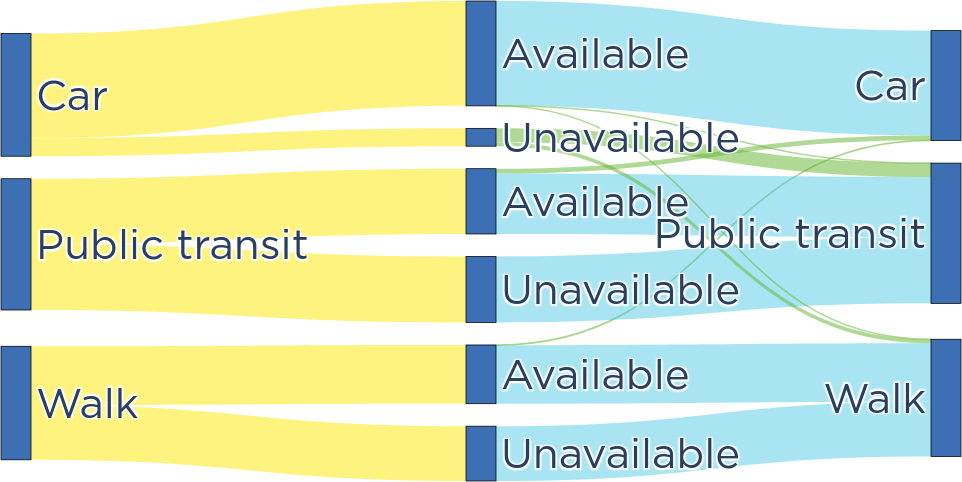
Available = clean car OR banned car with OD outside the LEZ
Unavailable = no car OR banned car with OD inside the LEZ
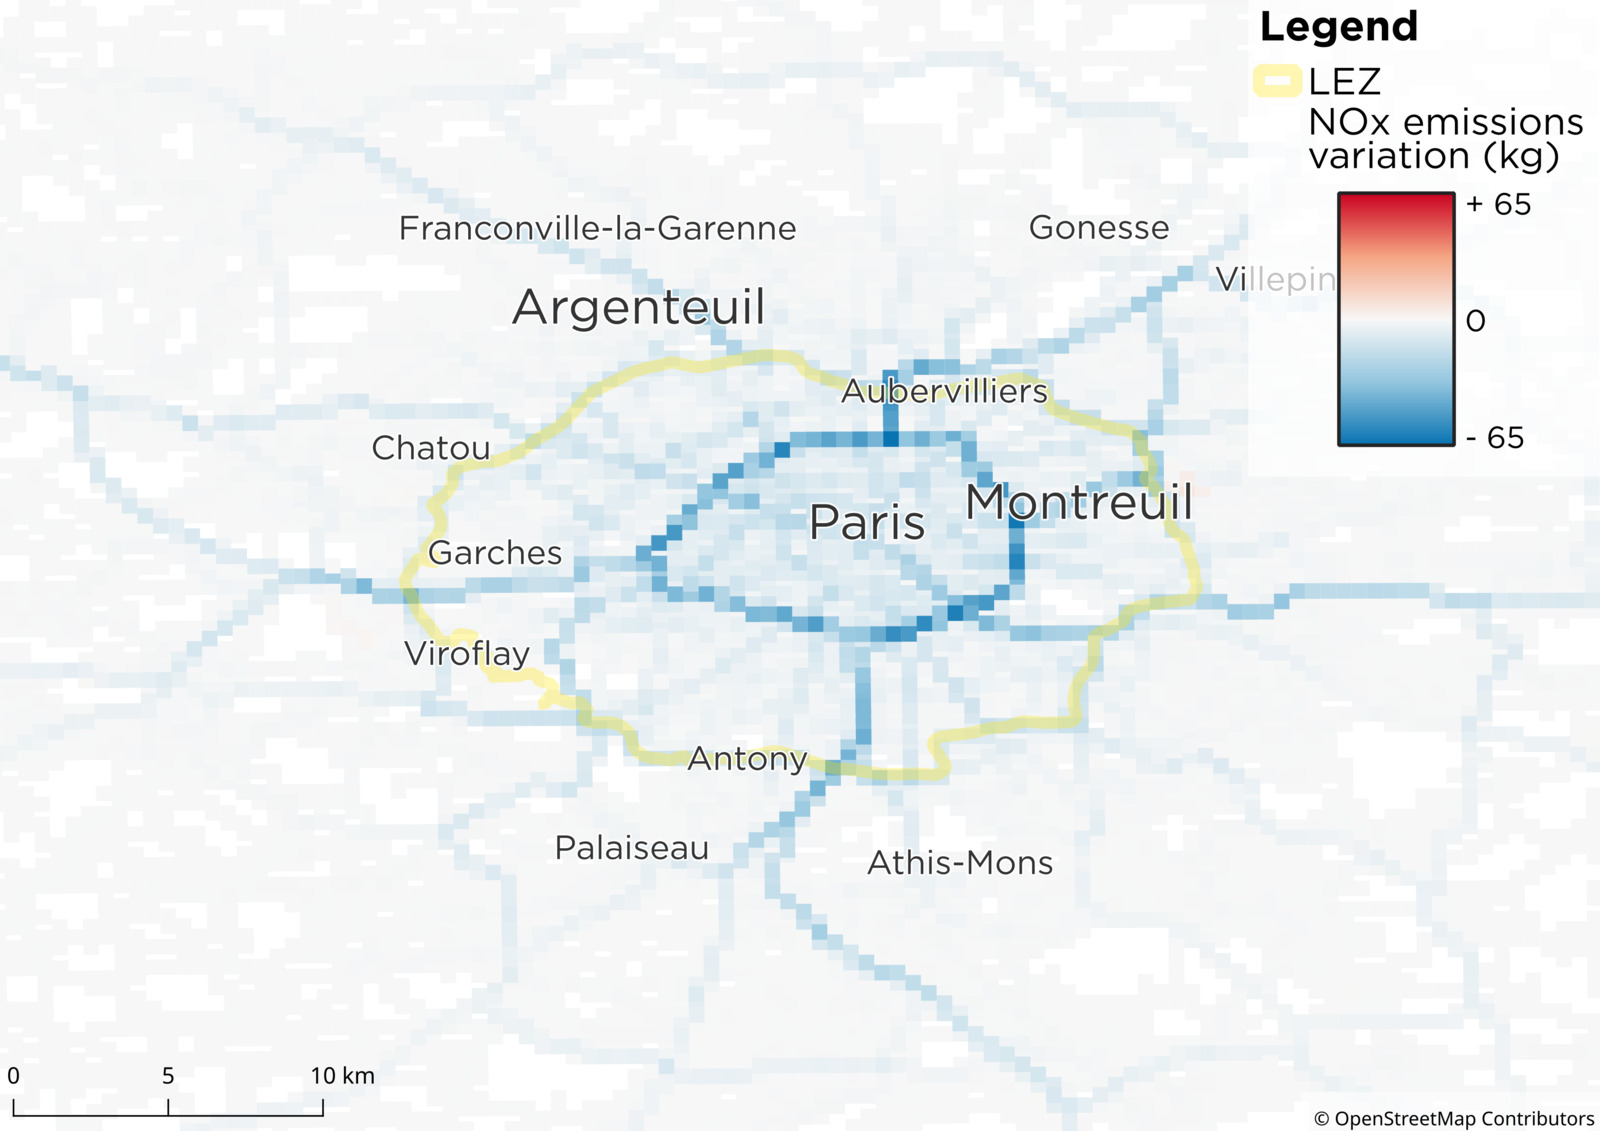
Air Pollution Impact
NOx, PM2.5 and CO emissions, dispersion and
population exposure are computed using METRO-TRACE (Le
Frioux, de Palma, Blond, 2023)
- Step 1: emissions of pollutants from car trips
- Step 2: dispersion of pollutants in the city over time
- Step 3: spatial distribution of population over time
- Step 4: health cost from exposure of population to pollutants

Emissions
Emissions are a function of vehicles' fuel type and age, and instantaneous speeds (EMISENS model)| No LEZ | LEZ-2025 | Variation | |
|---|---|---|---|
| NOx | 111 tons | 87 tons | -21 % |
| PM2.5 | 33 tons | 28 tons | -14 % |
| CO | 182 tons | 122 tons | -33 % |
| CO2 | 568 tons | 510 tons | -10 % |
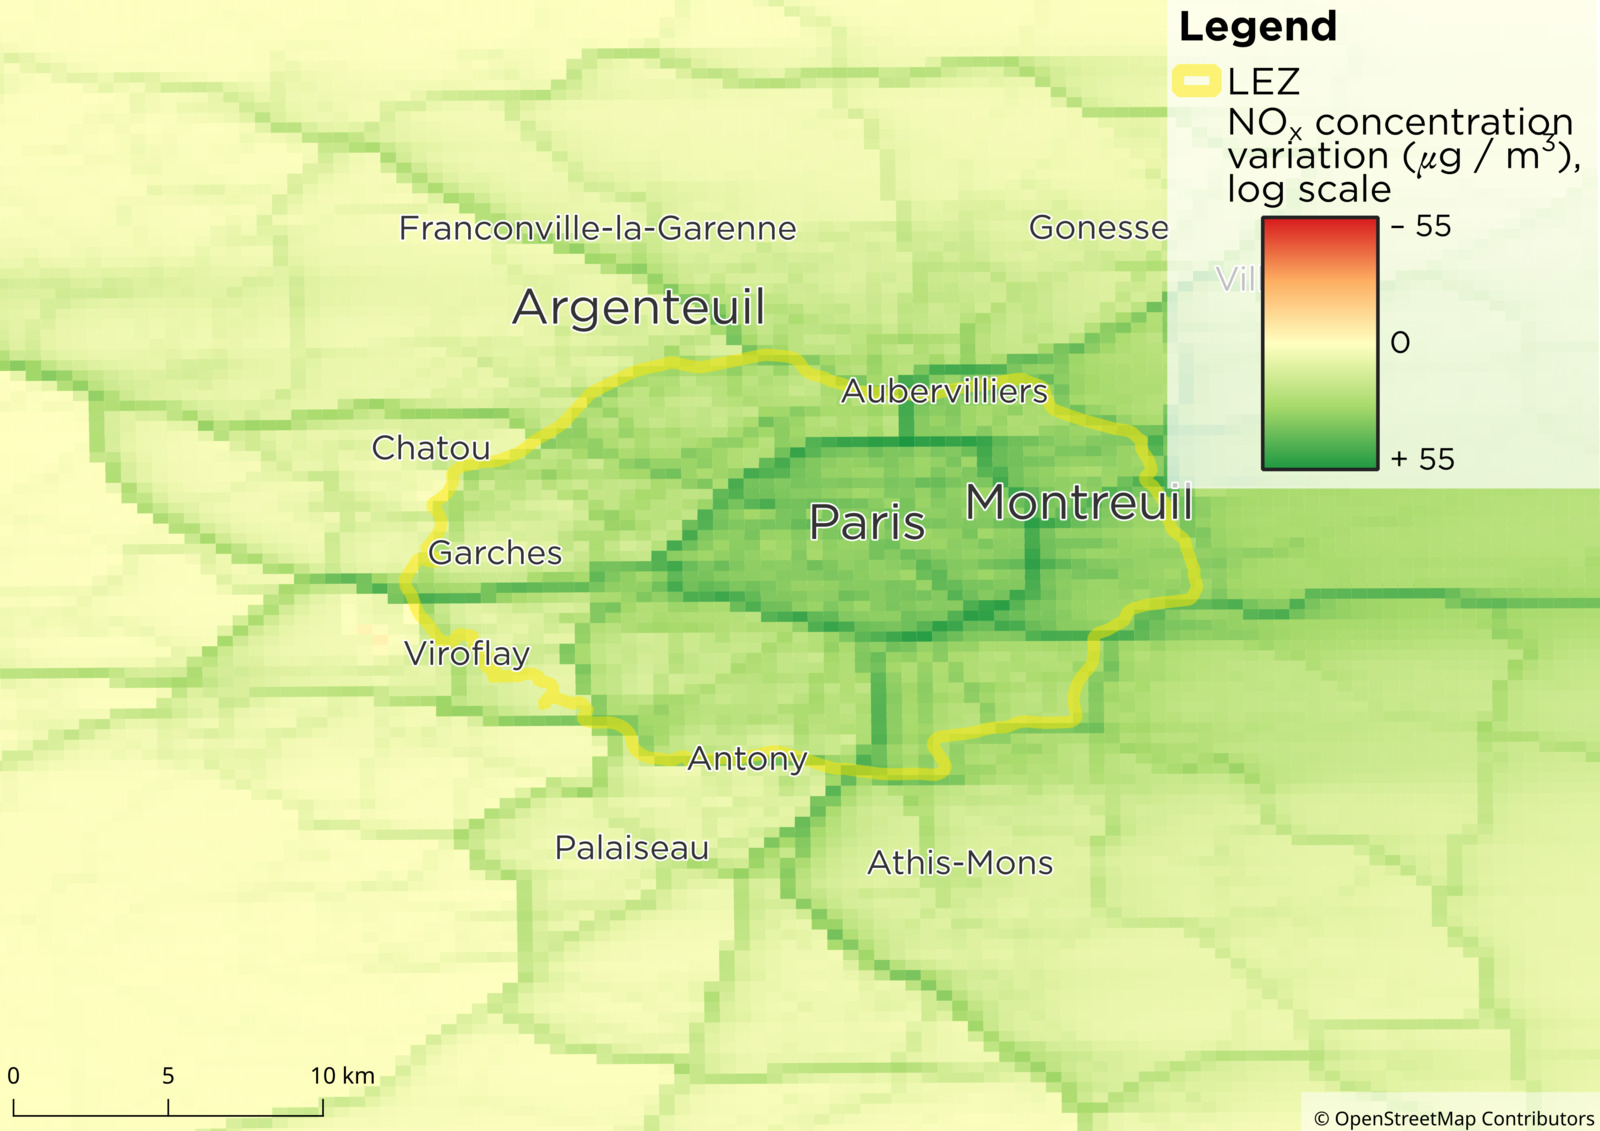
Dispersion
Pollutant concentrations are computed by propagating
emissions in the city using average wind speed and direction (Plume
model)
10 km/h West-to-East wind
| No LEZ | LEZ-2025 | Variation | |
|---|---|---|---|
| NOx | 3.25 μg / m3 | 2.55 μg / m3 | -22 % |
| PM2.5 | 0.96 μg / m3 | 0.83 μg / m3 | -14 % |
| CO | 5.38 μg / m3 | 3.60 μg / m3 | -33 % |
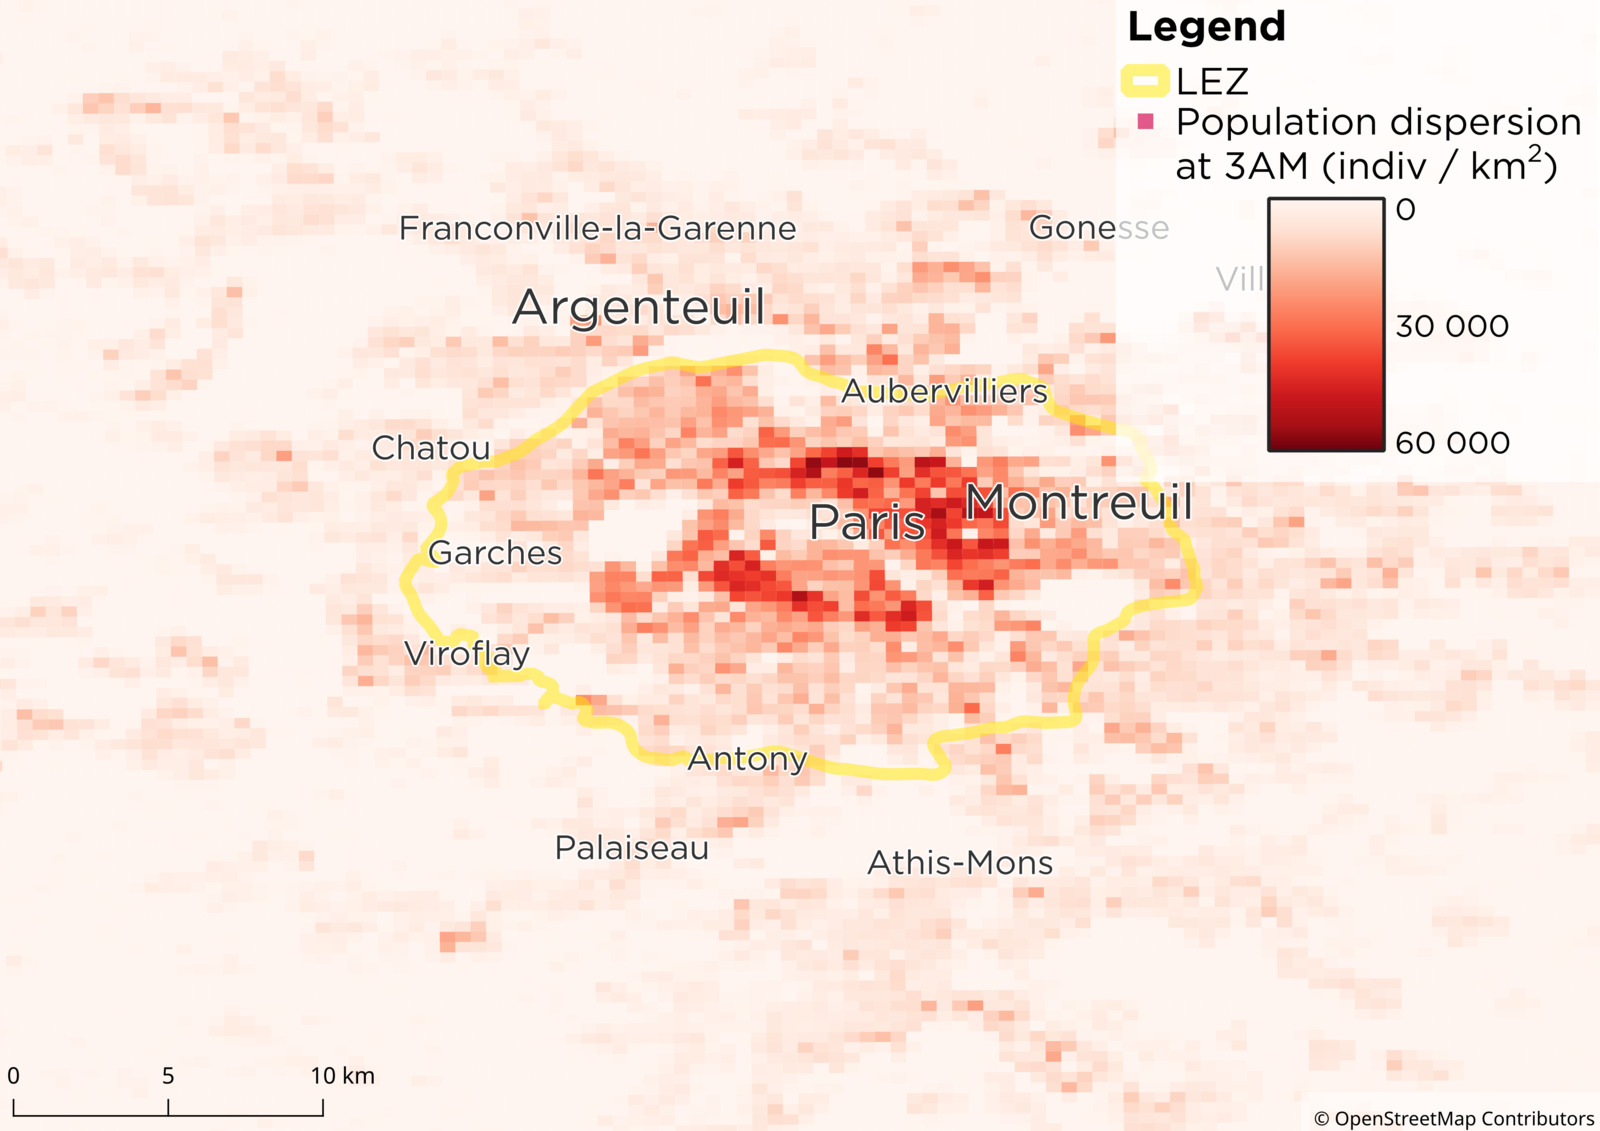
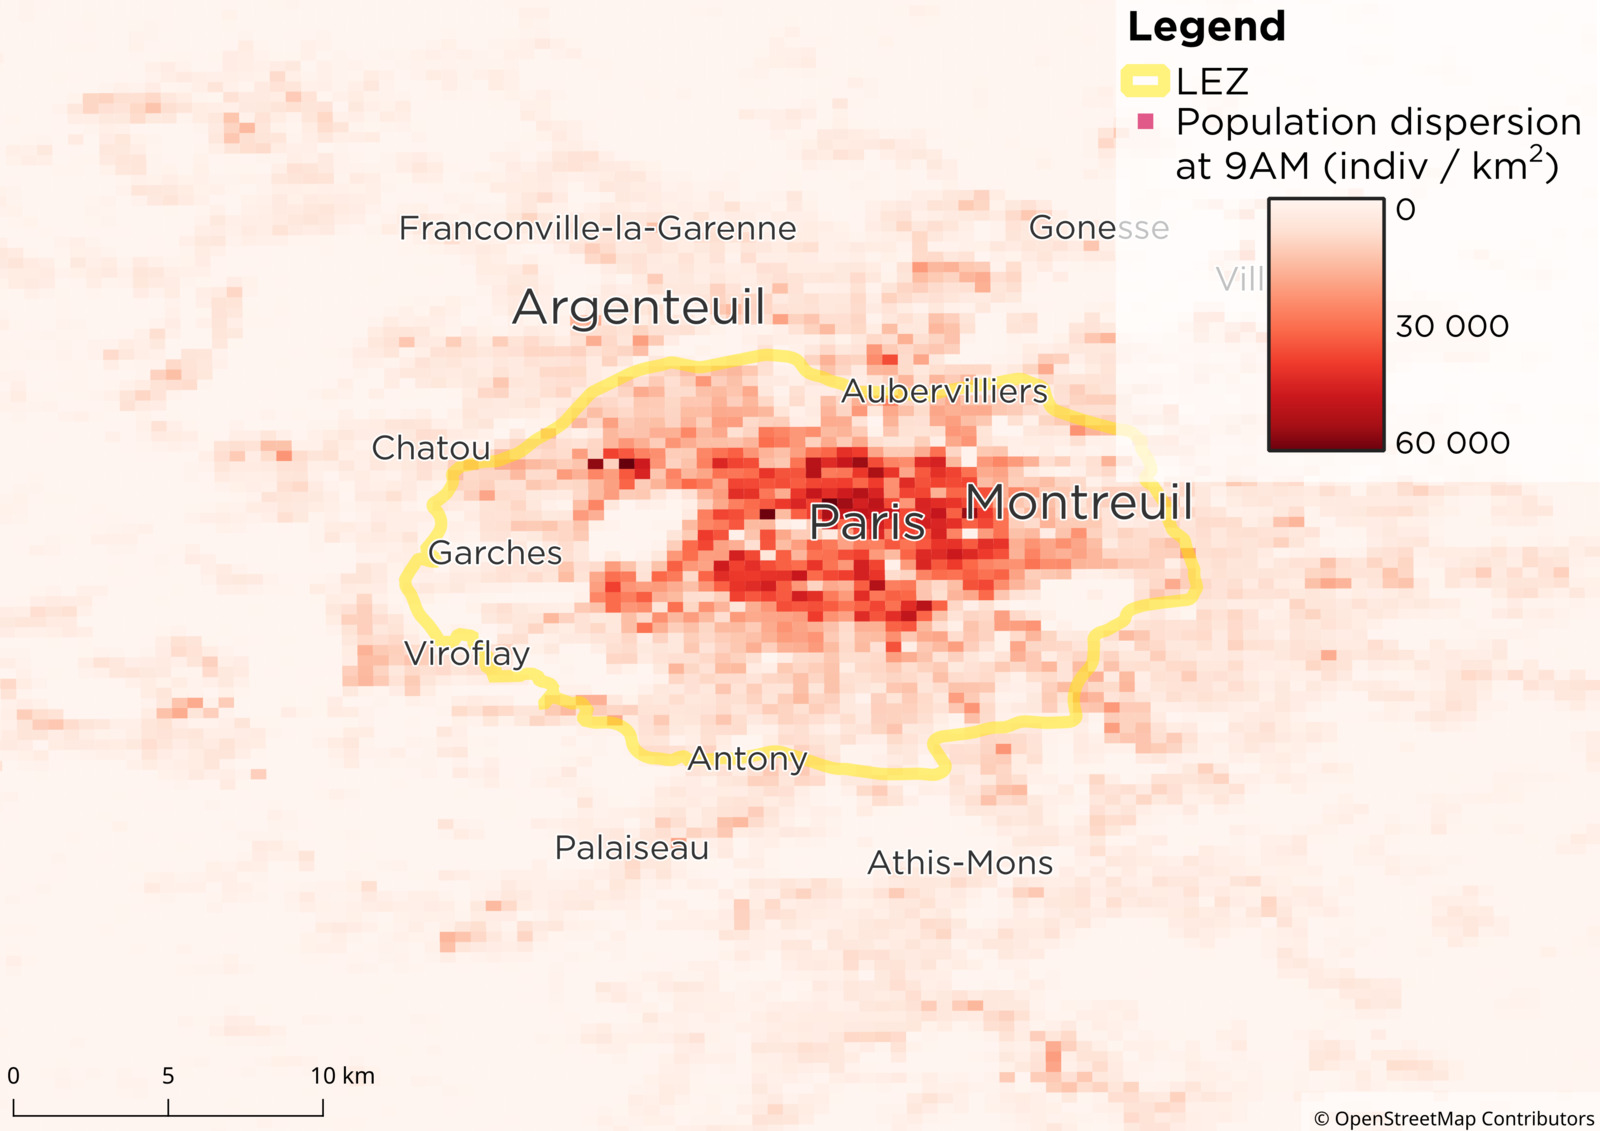
Population distribution
Individuals are dynamically distributed at origins, en-route and at destinations based on the output of Metropolis
Population distribution at 3AM
Population distribution at 9AM
Population exposure
Health impact of air pollutants on population are computed based on dynamic population distribution and pollution concentrations| No LEZ | LEZ-2025 | Variation | |
|---|---|---|---|
| NOx | 47.3 M € | 31.7 M € | -33 % |
| PM2.5 | 11.4 M € | 9.4 M € | -18 % |
| CO | 0.6 M € | 0.3 M € | -57 % |
Value of statistical life: 7.4 M €
Summary: Cost-Benefit Analysis
The benefits on air quality exceed the costs for owners of banned
car
| Travel surplus | - 565 k € | |
| inc. owners of banned cars | - 1 010 k € | |
| inc. owners of clean cars | + 445 k € | |
| Health surplus | + 18 052 k € | |
| inc. exposure to NOx | + 15 616 k € | |
| inc. exposure to PM2.5 | + 2 080 k € | |
| inc. exposure to CO | + 356 k € | |
| Environmental surplus (200 € / ton CO2) | + 95 k € | |
| Net surplus | + 17 582 k € |
|---|
Values are for a single morning peak (3AM to 10 AM)
Estimated net surplus increase over 1 year: 8.8 billion euros
Spatial Inequalities: Travel Surplus
Road congestion variation
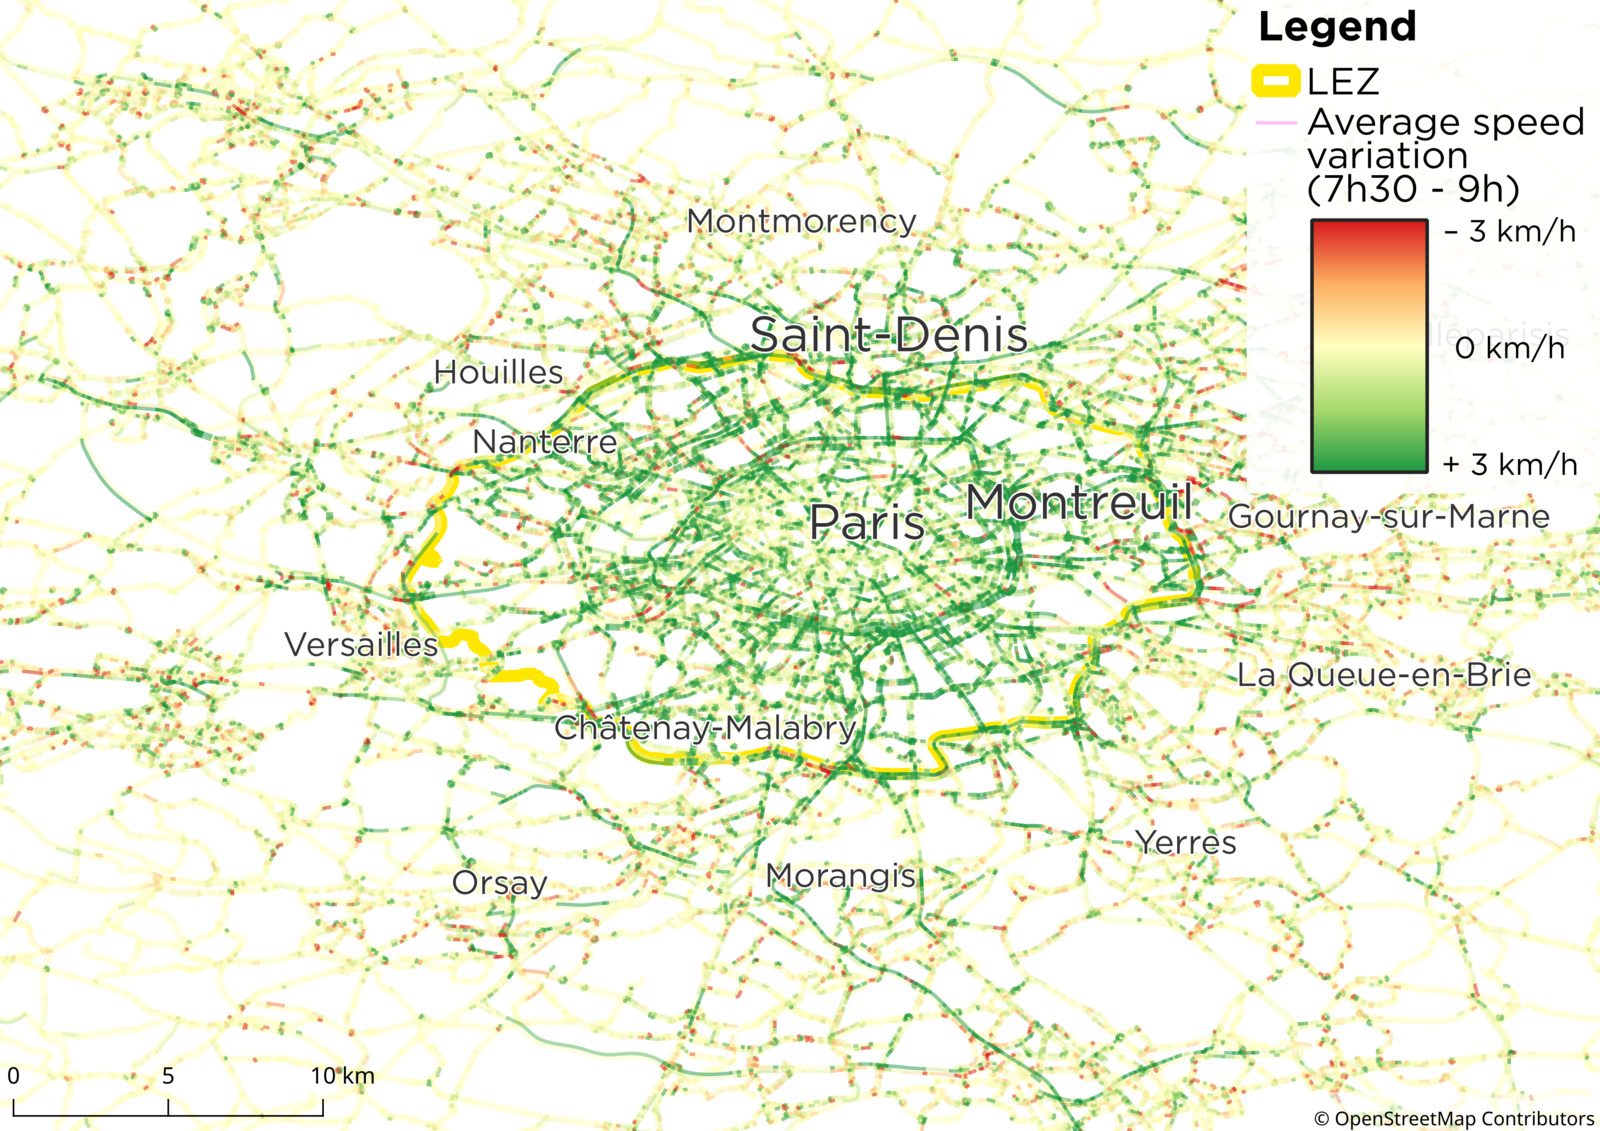
- Inside the LEZ: congestion decreases almost everywhere
- Outside the LEZ: congestion decreases on the roads leading to the LEZ
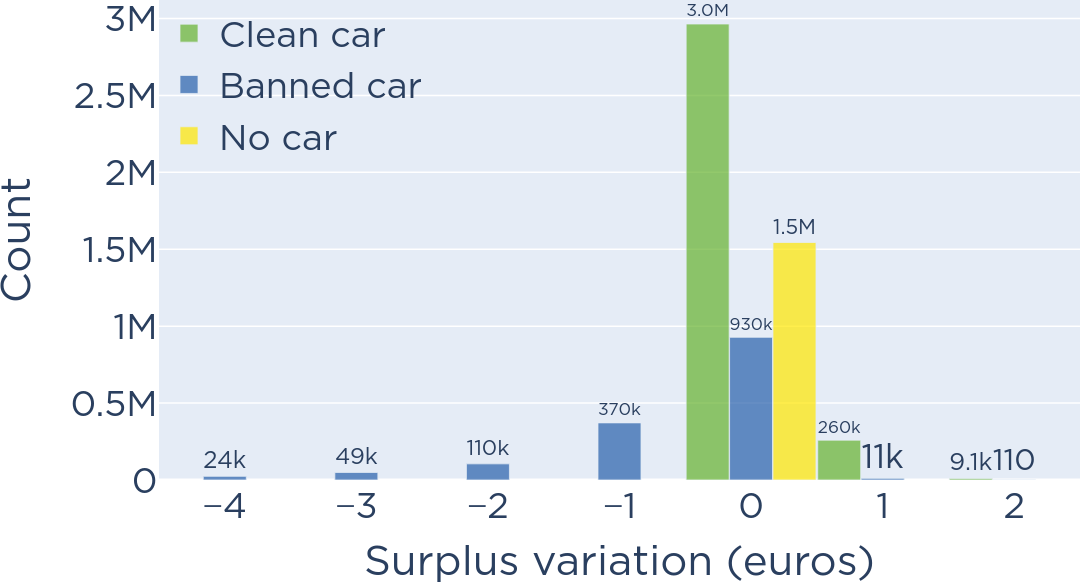
Travel surplus variation
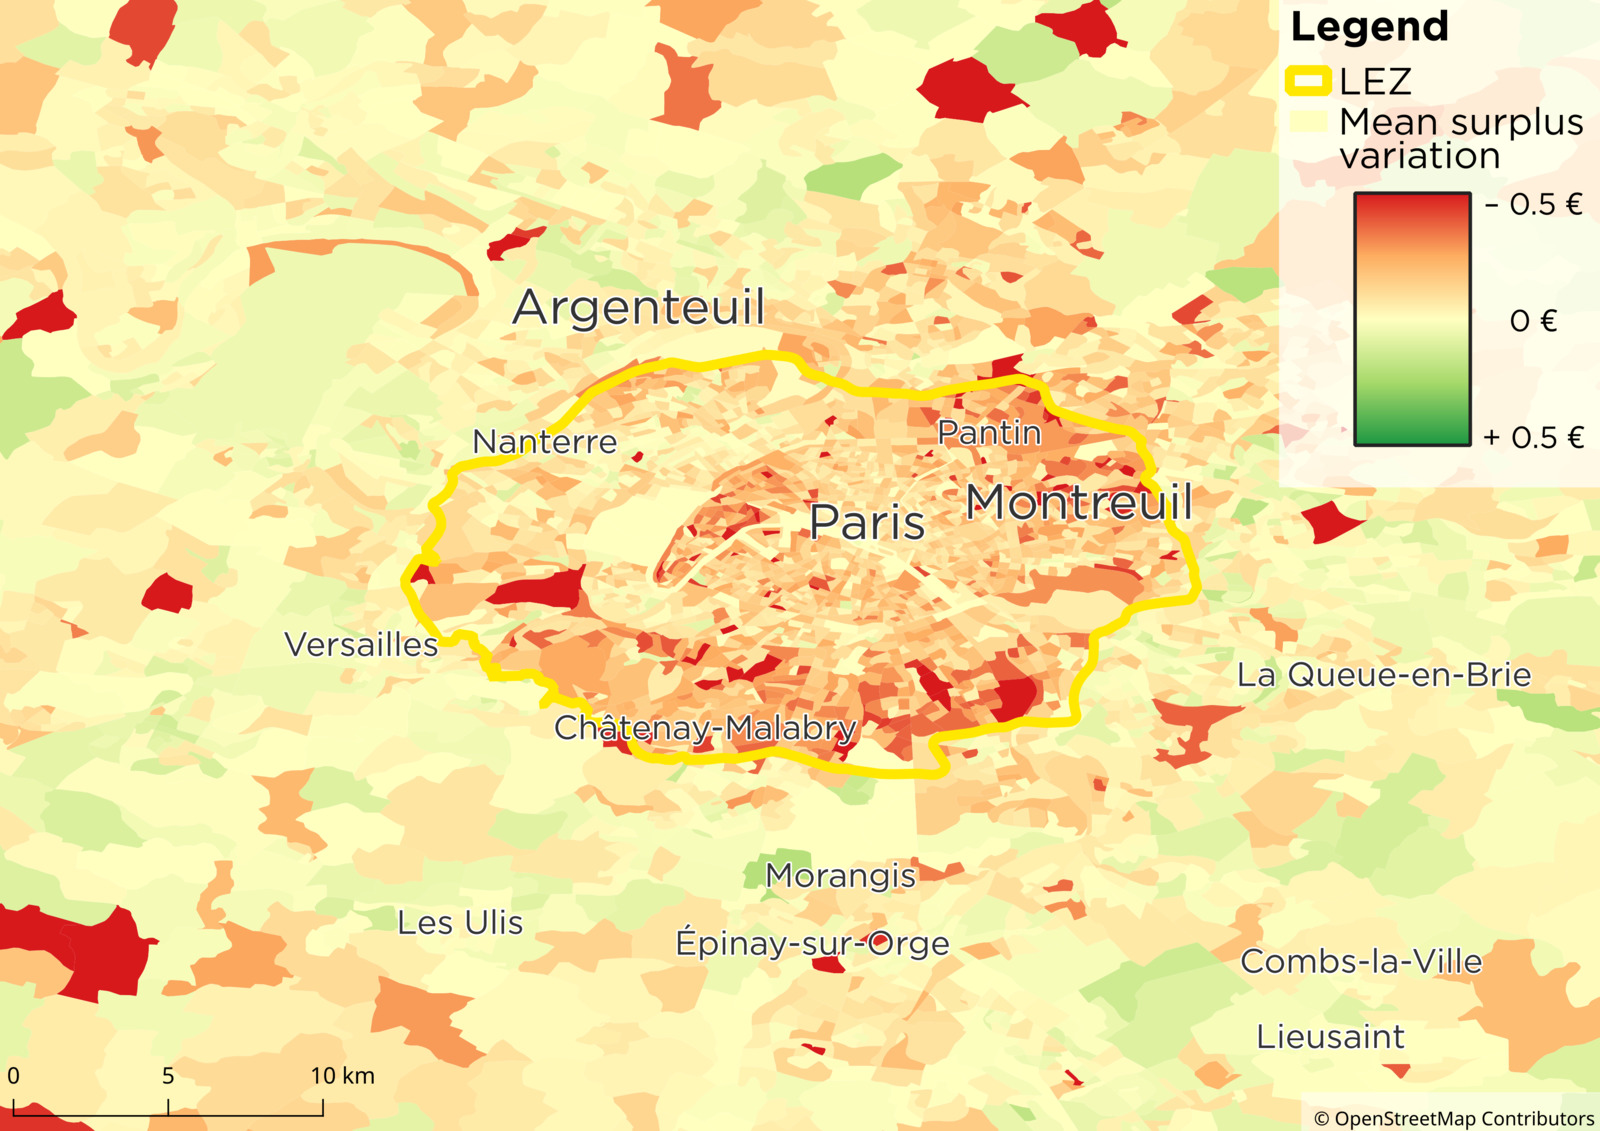
- Inside the LEZ: mostly losers because the banned car cannot be used anymore
- Outside the LEZ: some losers (car cannot be used to go to work in the LEZ), some winners (less congestion for those still taking their car)
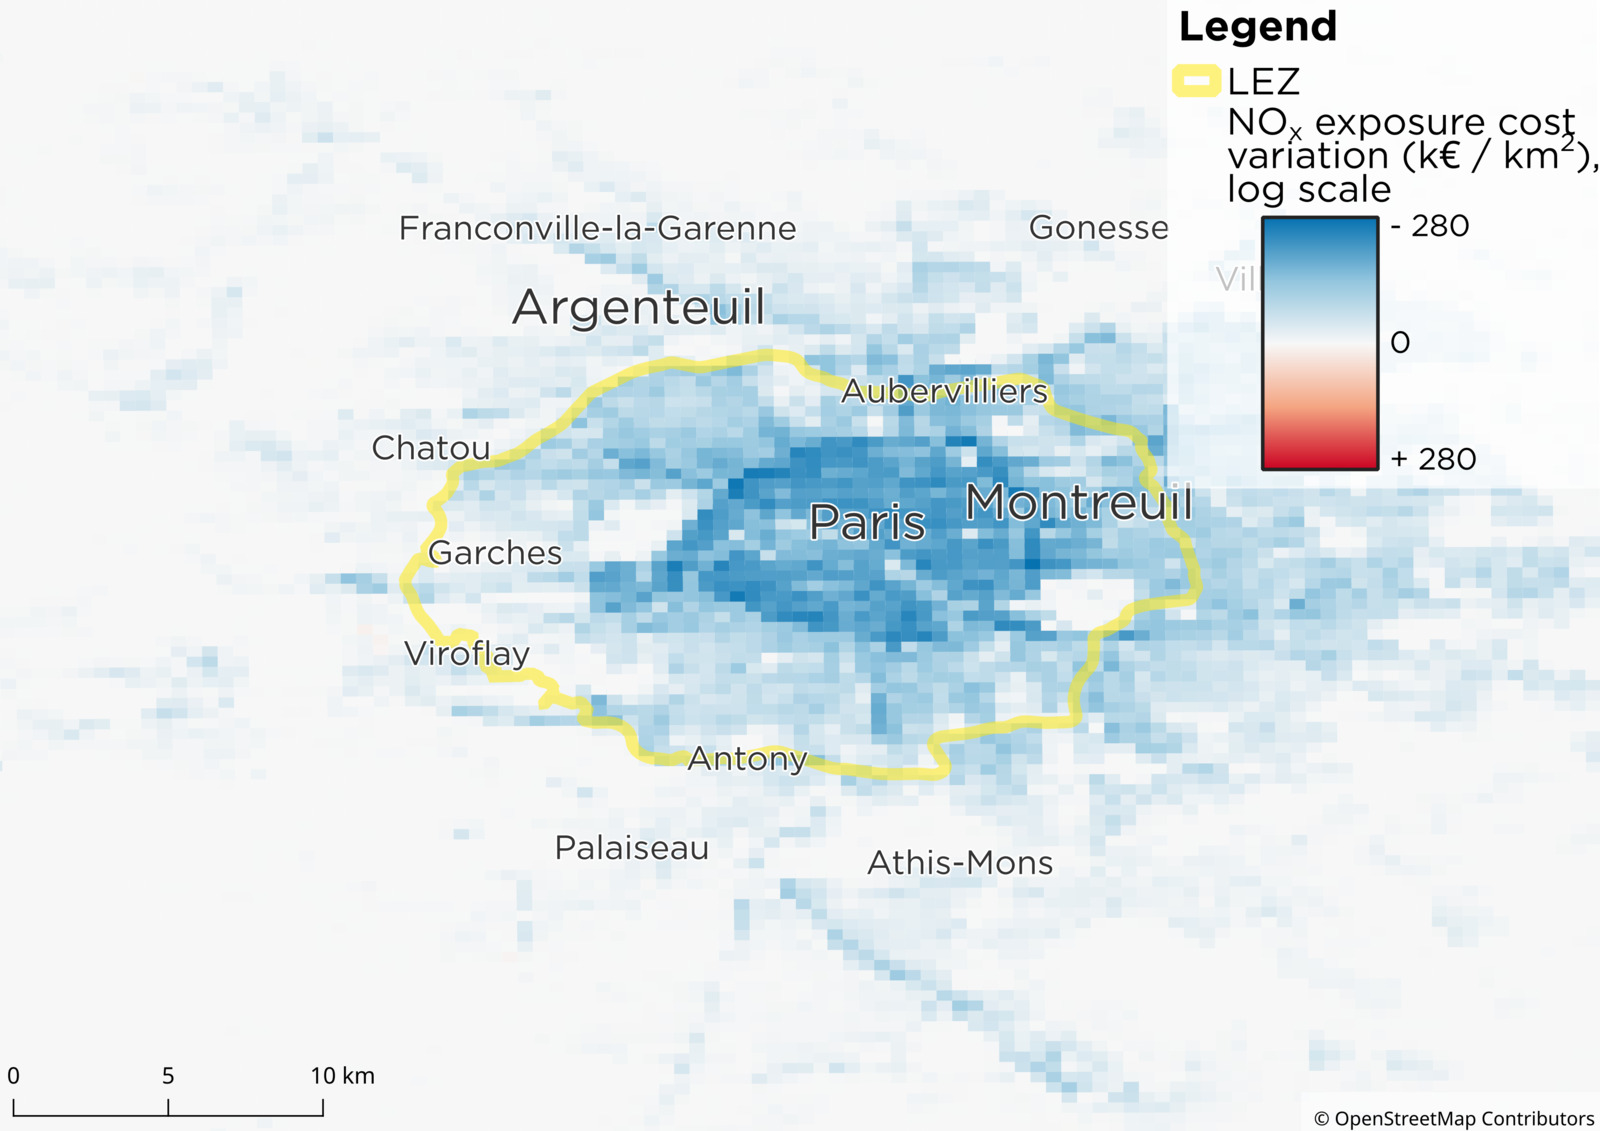
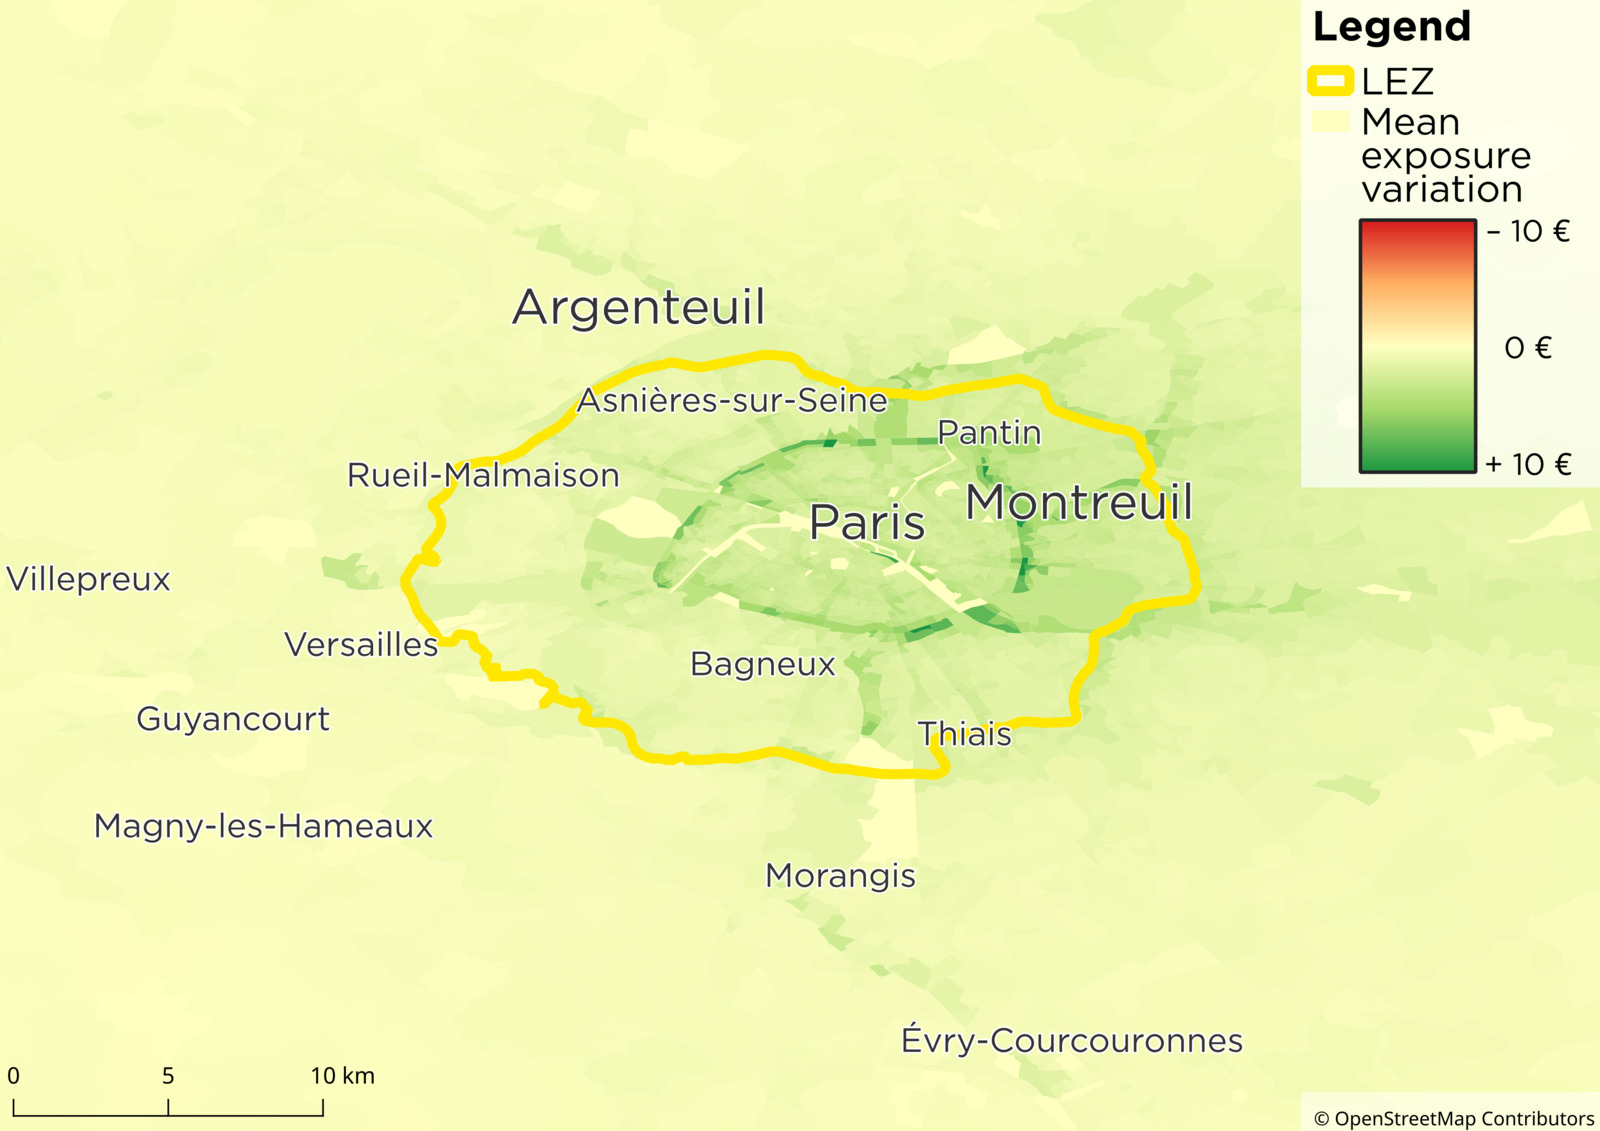
Spatial Inequalities: Air Quality
Population exposure variation
- Inside the LEZ: everyone wins, especially nearby the main roads
- Outside the LEZ: some winners in the East (wind direction) and nearby the main roads
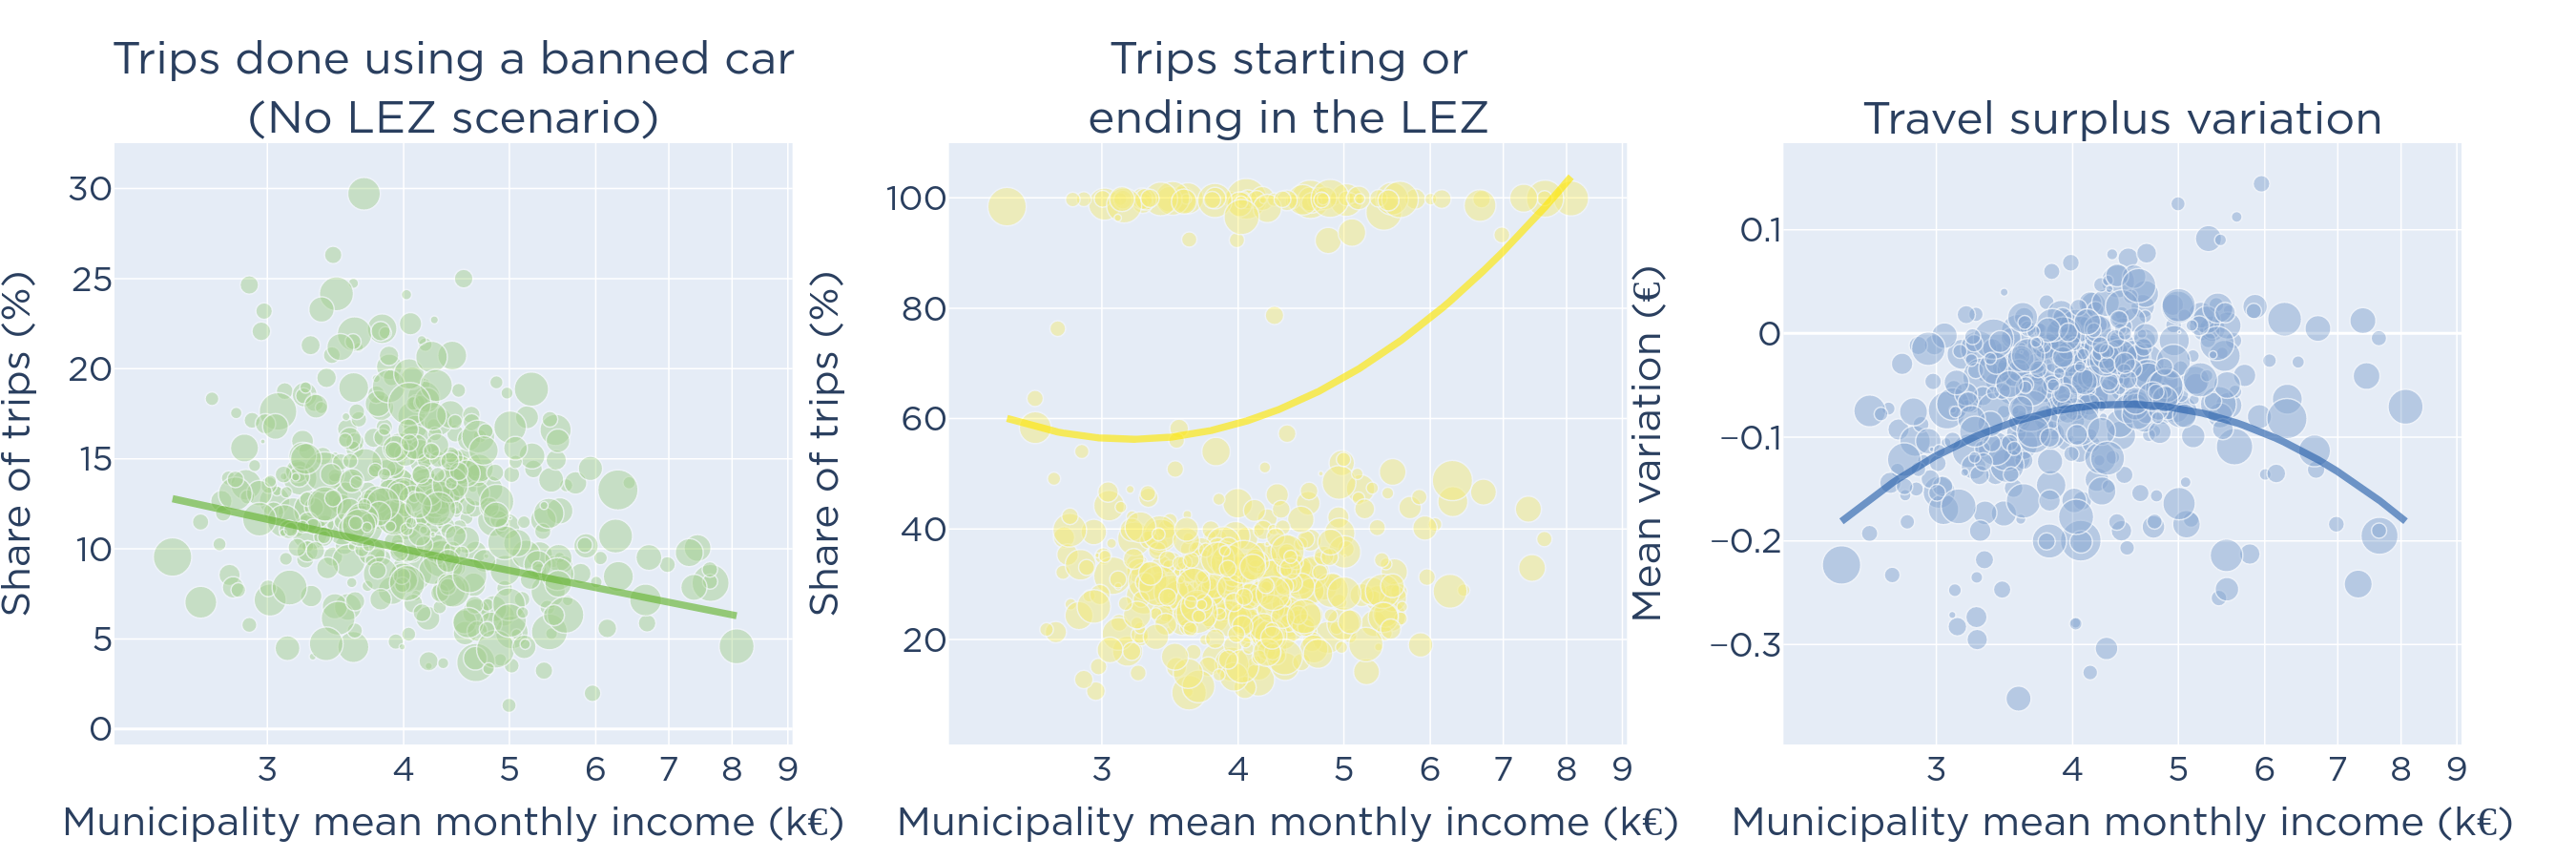
Economic Inequalities: Travel Surplus
- Travel surplus variation inside a municipality can be explained by two opposing effects
- Banned-car-use effect: Poorest municipalities are using banned cars more often
- Traveling-to-LEZ effect: Richest municipalities are traveling from / to the LEZ more often (they are closer to the LEZ)
- Global effect: Poorest and richest municipalities are loosing the most in travel surplus from the LEZ
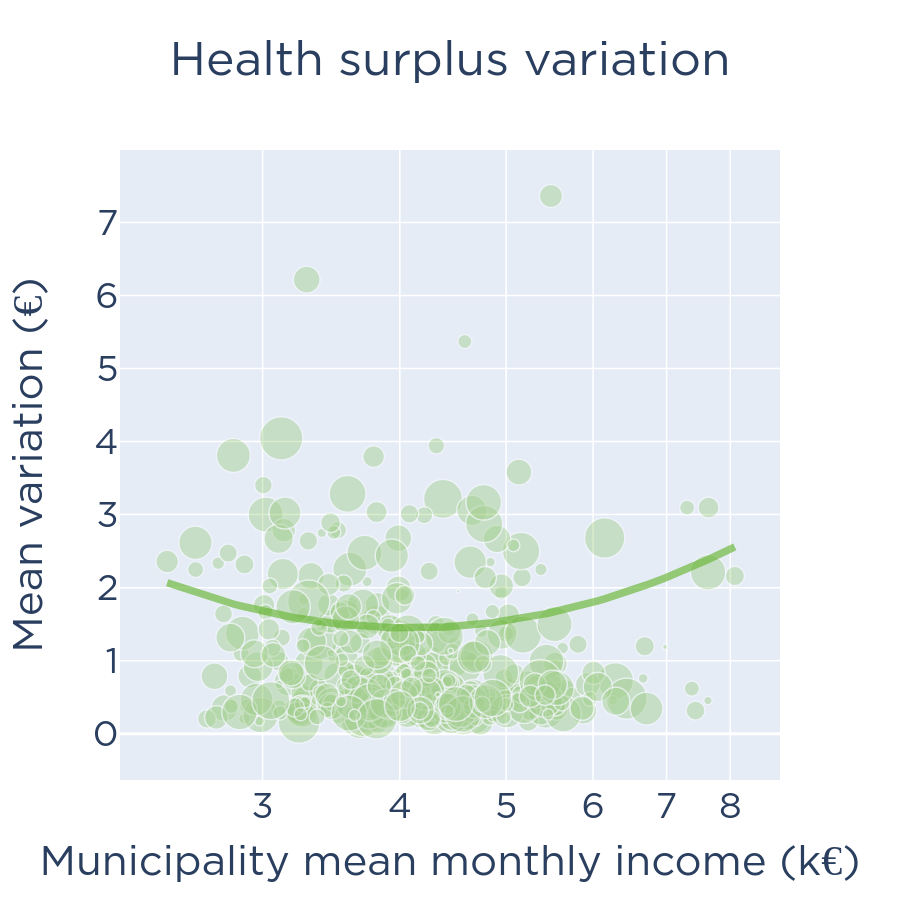
Economic Inequalities: Health Surplus
Poorest and richest municipalities are benefiting the most from
improve air quality because they are closer to the LEZ on average
Conclusion
Conclusion
- Aggregate impact of Paris' Low Emission Zone: the benefits (improved air quality + decreased congestion) exceed the costs (mode shift for owners of banned car)
- Inside LEZ: great improvements to air quality and congestion but many owners of banned car are negatively impacted by the restrictions
- Outside LEZ: small improvements to air quality; ambiguous effects on travel surplus
- Poorest and richest municipalities are the most impacted by both benefits on health and costs of traveling
- Middle-income municipalities are less impacted because they are mostly outside of the LEZ
References
- Adnan, M., Pereira, F. C., Azevedo, C. M. L., Basak, K., Lovric, M., Raveau, S., ... & Ben-Akiva, M. (2016, January). Simmobility: A multi-scale integrated agent-based simulation platform. In 95th Annual Meeting of the Transportation Research Board Forthcoming in Transportation Research Record (Vol. 2). Washington, DC: The National Academies of Sciences, Engineering, and Medicine.
- W Axhausen, K., Horni, A., & Nagel, K. (2016). The multi-agent transport simulation MATSim (p. 618). Ubiquity Press.
- Carslaw, D. C., & Beevers, S. D. (2002). The efficacy of low emission zones in central London as a means of reducing nitrogen dioxide concentrations. Transportation Research Part D: Transport and Environment, 7(1), 49-64.
- de Bok, M., Tavasszy, L., & Thoen, S. (2022). Application of an empirical multi-agent model for urban goods transport to analyze impacts of zero emission zones in The Netherlands. Transport Policy, 124, 119-127.
- Dias, D., Tchepel, O., & Antunes, A. P. (2016). Integrated modelling approach for the evaluation of low emission zones. Journal of environmental management, 177, 253-263.
References
- Holman, C., Harrison, R., & Querol, X. (2015). Review of the efficacy of low emission zones to improve urban air quality in European cities. Atmospheric Environment, 111, 161-169.
- Hörl, S., & Balac, M. (2021). Synthetic population and travel demand for Paris and Île-de-France based on open and publicly available data. Transportation Research Part C: Emerging Technologies, 130, 103291.
- Margaryan, S. (2021). Low emission zones and population health. Journal of health economics, 76, 102402.
- Le Frioux, R., de Palma, A., & Blond, N. (2023). Assessing the Economic Costs of Road Traffic-Related Air Pollution in La Reunion (No. 2023-09). THEMA (THéorie Economique, Modélisation et Applications), Université de Cergy-Pontoise.
- Wolff, H. (2014). Keep your clunker in the suburb: low‐emission zones and adoption of green vehicles. The Economic Journal, 124(578), F481-F512.